Atmospheric Rivers and Rainshadows

| comments

In past blogs I have talked about atmospheric rivers---plumes of moisture approaching our region that generally start in the tropic and subtropics. These moisture rivers are generally associated with warm air (since warm air can contain more water vapor than cold air) and they can dump huge amounts of precipitation when they interact with the substantial terrain of our region.

You know the most famous of these atmospheric rivers well...the Pineapple Express, which begins somewhere near Hawaii.

Not all atmospheric rivers approach us from the southwest, and our region is about to be influenced by one from a more westerly direction. The direction of the flow is very important. A nice video produced by NOAA is found below:


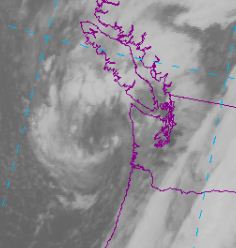
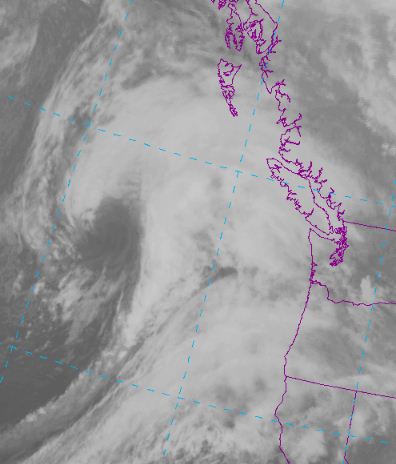
Here is an image showing you the total water vapor in a column predicted for 8 PM on Wednesday. A nice plume of moisture heading to us from the west-southwest. Not the equivalent of the real primo atmospheric rivers....but good enough to supply plenty of moisture.

As we will see the direction of the flow will be important.

In many a blog I have talked about local rainshadows and their brethren, the windward precipitation enhancement. Flow approaching a barrier (particularly moist flow) will produce copious precipitation, while descending air dries rapidly. Normally, our major precipitation events and primo atmospheric rivers are associated with southwesterly or south-southwesterly flow and the rainshadow is over Sequim and Port Townsend, home to many retirees and golfers. But these folks don't always get the shadow...when coastal winds turn more westerly the rainshadow shifts southward over Puget Sound and the lavender farms NE of the Olympics get wet.

That is what will happen tomorrow. Here is the 24h rainfall predicted for the period ending 5 AM on Thursday. The rainshadow will move southward and north Puget Sound will be virtually rain free, while the Cascades and the Olympics get pounded with as much as 5-10 inches of rain. Rivers will rise rapidly and some flooding is possible (see the NWS web site for flood watches and warnings). There is also a substantial avalanche threat with all the snow we have had lately gets hit by heavy rain and warm temperatures. Sequim looks soggy too!

Here is the 72-h rainfall ending 5 AM on Friday. The north Cascades will really get drenched with almost the whole area predicted to get 5-10 inches. Add to this all the snow that will melt implies very serious flooding potential.

So if you want to stay dry tomorrow...head to southern Snohomish County or the northern Kitsap....or drive over to Vantage on the Columbia River....

Visit to China, the Great Firewall, and An Amazing Jet

| comments

You might have noticed my blog decreased in frequency a bit during the past week and there were some issues with the graphics.

The reason?...I have been in Beijing the last ten days giving a short-course on weather systems and forecasting technology to forecasters from throughout China. My colleague in this adventure was Brad Colman, head of the Seattle Office of the National Weather Service. I was really impressed with my Chinese colleagues--they want to build a first-class weather infrastructure in their country and seem to have access to the resources to do so. And they are gracious, kind hosts.

But one thing I found very frustrating was the difficulty of controlling a blog from China. The GREAT FIREWALL does not like Blogger and disconnected when I tried to access it. Using friends in the U.S. or applying VPN or proxy-server approaches were only partially successful. Anyway, I am back in the U.S. now....so I can work again. But the restrain on communication via the FIREWALL really makes a lot of communication difficult in China.

Coming home I experienced the impact of an amazingly strong Pacific jet stream. Here is a short-term forecast of wind speed (knots) at jet stream level (300 mb--roughly 32,000 ft) while I was crossing the big ocean.
A very strong jet stream over the western Pacific! So strong that the aircraft did not follow the normal great circle route or anything like it....we headed straight across the ocean....a far longer distance. I was amazed to follow the trip diagnostics on the screen in front of me...at some points the tailwind approached 190 mph and the speed relative to the earth's surface was nearly 800 mph!! Even going a long route we got in roughly an hour early (about 10.5 hours from Beijing to San Francisco). Our flight even passed just south of the damaged reactors in Japan.

The ride was quite bumpy at points, since we were hanging so close to the jet stream (the large changes in wind speed in the vertical can cause wind shear that breaks into turbulence).

And the airline food on United was some of the worst I have ever eaten! The snack was a "cup of soup" they poured hot water into. And that was the highlight of their cuisine in economy class! Most meteorologists can not afford business class.

Amazing Sierra Snows

| comments

Although the Cascade snowpack is roughly normal this year (which is low for a La Nina year in which we expect it to be above normal), the central Sierra Mountains of central CA have been hit very, very hard.

The Alpine Meadows ski resort near Lake Taho is closed today due to unprecedented snowfall, high high winds and avalanche hazards.

The nearby Squaw Valley has had the greatest seasonal snowfall on record, with 45 inches overnight at 8200 ft.

Snow has even hit lower elevations in northern CA, with highway 101 closed between San Francisco and Eureka.


The good news for California is once they get through Saturday that West Coast trough that has taken the cold and precipitation down into California (and yes, generally away from us) will shift back north. The Northwest should be visited by increased rain and mountain snow next week.

All of the above shows the dangers and uncertainties in an El Nino/La Nina winter forecast. We had expected WA to have above normal snow and the Sierra's less than normal. Hasn't quite worked out that way. Statistical relationships are just that...and having something more probable does not mean it will happen.

But don't give up on the Northwest snowpack---it will probably increase significantly during the next week as the jet moves our way.

Finally, A Warm Day

| comments

Today several locations in western Washington reached in the low 60s....in fact some surged into the mid-60s. Offshore flow helped....as air descended down the western slopes of the Cascades it it is compressed and warmed. Here is the profiler data for today from Seattle and you can see the strong SE flow off the Cascades.

And here is the model surface winds, pressure, and lower atmosphere temperatures at 2 PM. You can see the offshore flow there as well.


Here are the temperatures of the past 4 weeks...today really stands out as the first to really get above normal. In fact, this year is extremely late for us getting to the high-50s: the 5th coolest in that respect.

California Gets Hits

| comments

You want intense weather? Then head down to California! With a high amplitude trough over the eastern Pacific, one system after another is heading to California. Here are some amazing statistics noted by my colleague Mark Albright:

Point Reyes north of San Francisco reached 79 mph.

At Burns Canyon 20 miles N of Palm Springs at 6300 ft, there was a wind gust of 96 knots (110 mph) at noon Sunday 20 March 2011. In contrast, at 11 AM the wind was nearly calm at Palm Springs.

The 27-hr total ending last night at 10 PM 20 March 2011 was 6.06 inches in Santa Barbara of which 4.13 inches fell in just 12 hours. Their monthly (28 days) total has now mushroomed to 7.78 inches.

AT SANTA BARBARA YESTERDAY WAS THE WETTEST CALENDAR DAY ON RECORD...AS THE 5.23 INCHES OF RAIN WHICH FELL EXCEEDED THE PREVIOUS RECORD OF 4.74 INCHES RECORDED ON MARCH 15TH 2003. That is a big one.

Many of southern CA stations had their daily records.


The general pattern is going to continue for a while, but with a shift of the precipitation into central and northern CA. The mountains of northern CA will get hit by 2-5 inches of rain. We are going to be quite dry in comparison to those poor souls in CA. As I noted the current pattern would send any Japan radiation into CA,.


Good news. The National Weather Service has secured the property for the new coastal radar (on Langley Hill) and work on clearing and preparing the land is now beginning.

Changing Weather Pattern Reduces Radiation Risk, Brings Improved Weather

| comments

The large-scale weather pattern has shifted in a way that is going to give Seattle far better weather than southern California and protect us from any Japanese radiation for a while.

What configuration can provide such a boon? Large-scale troughing on the West Coast that is going to send weather disturbances to our south.

Here are two upper-level weather maps for the 500 mb level (roughly 18,000 ft).

The airflow parallels the lines and the closer they are together the stronger the winds. A strong trough will be resident along the coast and the current of strong winds...often known as the jet stream...will be heading south into LA-LA land. Thus, while substantial rainfall will be falling over CA we will remaining generally on the dry side. In fact, this is currently a flash flood watch and wind advisory for LA! And with the flow moving south into CA any radiation-bearing particles crossing the Pacific will head south toward southern CA.

The Northwest has been sufficiently wet that even if we don't get a drop for the rest of the month, we will still have normal rainfall for March.


Latest On Japanese Radiation

| comments


There is still a huge amount of interest and publicity over the radiation emitted by the damaged Japanese reactors in Sendai and the potential for radiation spread to the U.S.

As before, there is little if any risk of significant landfall of radioactive materials on the West Coast due to the mixing, settling, decay, and rainout of radioactive materials...even if the trajectories were straight into us.

Consider the issues. First, you need a large source injected into the atmosphere. THIS HAS NOT HAPPENED YET! Measurement by the U.S. assets during the past day have shown that significant radiation has not spread beyond the immediate facility. Then you have to effectively loft the material higher into the atmosphere, where the strong flow aloft can move it westward. THEN, you got to bring it back down to the ground. Mixing will continuously reduce the concentrations as the material spread across he Pacific with plenty of opportunity for precipitation to reduce the concentrations farther.

Here are the latest trajectories from the hysplit model (see graphic). The lowest level starting trajectory heads to the Bering Sea due a strong storm in the western Pacific. And the stuff gets lofted away from the surface. The middle trajectory (starting at 4500 meters) heads to Calfornia, but takes a week to get there...plenty of time for concentrations to dwindle. The highest level moves faster but the stuff stays high while it crosses the West Coast.

Anyway, although the trajectories will change day to day as the flow changes, there is little to be worried about for us.

Revenge of La Nina

| comments

Putting aside the cross-Pacific radiation issues for this blog (again, absolutely no reason to be concerned here on the West Coast), we have had notable very heavy precipitation during the past several days. Slides have stopped north-south train traffic, strong thunderstorms with thunder and lightning have pummeled the lowlands, and some mudslides have blocked local roadways. Slides on the rail right of ways has become a major problem--take a look at the video on the side bar (to the right) to view a typical NW landslide on to the tracks between Seattle and Edmonds.

Lets start with the precipitation over the last two weeks at Sea-Tac (see graph): roughly twice normal--so half way through the month we have "enjoyed" a normal whole month's total.

Here is the cumulative precipitation (top figure) this season for the Cedar/Tolt rivers (the main water supply of Seattle). Yes, we are ahead of normal (consistent with La Nina). The bottom panel shows snowpack for these watersheds--rapidly catching up to normal after being well below normal. You will be able to water your lawn this summer.

Looking at the precipitation for the last 48h from Seattle Rainwatch
An amazing 4 to 6 inches from north Seattle westward. No wonder there were slides on those tracks!

For days we have been getting very heavy bands of convective showers moving through. Take today at 2:30 PM (see below). Lots of yellows (heavy rain) and even some reds (downpour and or hail).
One very heavy thundershower moved through this afternoon and an image shown on the KOMO-TV website (reproduced below) strongly suggests a rotating "wall cloud". I would not be surprised at all if someone saw a funnel coming out of this feature.

More rain tomorrow...but believe or not, Thursday and early Friday should be dry!

Returning briefly to the tsunami issue...it turns out that my idea of building safety towers has been considered for a long time (should have known)...it is called vertical evacuation. There are a few projects being considered on the Oregon and Washington coasts...but nothing sufficient to deal with the problem. What will it take to make the investment to build enough vertical evacuation facilities to have a hope of saving most of our coastal population in case of NW tsunami? This is also homeland security--for a fraction of the funding used to building that fence along the Mexican border we could protect all our coastal folks.

The U.S. West Coast is NOT at Risk from Radiation

| comments

Today I got calls and emails from all sorts of folks, worrying about the Japanese radiation reaching the Northwest in dangerous quantities. Potassium iodide pills, used for thyroid protection from radioactive iodine have been stripped from the shelves in Seattle.

I think the reality is clear...there is no serious radiation threat to us here in the Northwest.

First, I should note that the weather pattern is shifting and the latest trajectories show that the low-level trajectories don't reach us.(see below) The low-level trajectories circle around in the Pacific and the upper one heads south of us. (Yes, there is uncertainty with this and it is only as good as the National Weather Service GFS model)


But even it they were heading straight for us..there is little to fear.

From virtually a point source, the radiation would mix through huge volumes of the atmosphere due to horizontal and vertical mixing. Since it would take days to reach us, there would be time for larger particles to settle out and precipitation would wash some out as well. Even for Chernobyl, where the core exploded while the reactor was powered up and where there was no containment, serious radiation only extended roughly 1000-1500 km away.


The Northwest is more than 7000 km away!

Clearly, the situation in Japan is serious and tragic, but the U.S. is not threatened.

Thinking about the tsunami I wondered whether locations threatened by tsunamis like coastal Japan (and coastal Oregon and Washington) should build escape towers. Steel and concrete buildings were not toppled by the Japanese tsunami....what if structures that could hold 200-1000 people were positioned regularly along the coast, giving people another option for safety. This would be much cheaper than sea walls and the like, which didn't seem to work anyway. Here in Washington I think of the Long Beach peninsula...a tsunami deathtrap if one ever existed. A few such towers could save many, many lives in case of a major event. And they could be relatively cheap...perhaps as simple as a wide suspension bridge between two towers.


Is this a viable idea? If it is, why aren't we doing it? Now.

Latest Pacific Trajectories From the Japanese Reactor and Amazing Rainshadow

| comments

A few people emailed me asking for update trajectories from the vicinity of the Japanese reactors. These trajectories use the NOAA Hysplit model, driven by output from the U.S. GFS global forecasting model. I have launched trajectories from 50, 4500 and 9000 meters above the surface. Keep in mind that there are considerable uncertainties in such trajectories. So here they are:Strangely, the trajectory starting at 50 meters ends right over Seattle...after nine days!! Even if this was true and the initial concentrations were large, trubulent and diffusive motions in the atmosphere would reduce concentrations over us to minimal, if not infinitesimal, levels.

This time of the year there is often good transport across the Pacific. It is not unusual for smoke and dust from Asia to reach us in measurable quantities...but these are extensive sources spread out over a huge area (see graphic below for an example)


Professor Dan Jaffe of UW Bothell is an expert on such cross-Pacific transport and has documented the movement of particles and chemical species across the Ocean.

On another topic... there is an extraordinary rain shadow today. Take a look at a typical radar image this morning:The San Juans have essentially been completely dry. Only .01 inches in Friday Harbor! A trace at Whidbey Island Naval Air Station. But .31 inches here at the UW. The rain shadow extends all the way to Bellingham where only a trace has fallen. Just shows you that even on wet days, you can escape it by heading for the current location of the rainshadow.

Where would the radioactivity go?

| comments

Although any injections of radioactivity for the damaged Japanese reactors would be highly diffused, with very low concentrations, by the time it got to us, I did a trajectory analysis using the NOAA Hysplit Model. I first released the trajectories in the general region of damaged region at 10, 1000, and 5000 meters. Here is what I got:And there I tried some higher levels: here are trajectories released more at jet stream level (7000 and 9000 meters):I tried several levels because it is uncertain to what level the radioactive materials will rise. It would injected by an explosion, diffuse vertically by turbulence in the atmosphere, be pushed aloft by atmospheric convection or rise with the vertical motion associated with weather systems (like fronts and cyclones)

But there is a bottom line: what does gets injected is generally heading our way...particularly at jet stream level (9000 m) and near the surface.

You may not believe this, but some of the survivalist and anti-nuclear web sites are already going nuts about the "threat." On CNN right now they are talking about the potential for a melt down of at least one of the Japanese reactors, but it is clear that this will not be a Chernobyl level release in any case.

But taking a more philosophical angle, it is clear that both the ability to a Japanese tsunami to influence our coast, and the threat of radioactivity injected into the atmosphere there to move our way on the jet stream shows that we cannot consider our environment in isolation from the rest of the world.

PS: Here is a good editorial on the Common Core math standards

Tsunami

| comments

A number of people emailed today about the tsunami, including their concerns about radioactivity from Japan reaching the Northwest.

It turns out that the leading national research center for tsunamis is here in Seattle (National Center for Tsunami Research). At the Center they have developed numerical simulation models for tsunami events.

Here is a simulation of the unfolding of this event (click on it to enlarge):


You see how complicated the structure is? Multiple waves, reverberating off obstacles in the basin and refracting around islands.

Here is the maximum tsunami amplitude map there produced:

The largest amplitudes were near Japan of course, but significant amplitude propagated thousands of miles away. This predictions suggested northern CA would get hit harder than us and it was correct.

At Crescent City the observed maximum tsunami amplitude reached nearly 7 ft, while the NW coast only saw .5 to 1.5 feet. Impressive prediction.

Tsunamis...known as "harbor waves" is Japan...are produced when earthquakes cause a displacement of a water volume in the ocean. This generates waves that can move at tremendous speeds over deep water.... as a jet aircraft! Amazingly, the passage of a tsunami wave over the deep ocean is nearly imperceptible.

But bad things happen when the wave approaches a coastal zone. The propagation speed of the wave decreases when the water becomes more shallow and the water converges and rises, producing huge waves that can reach 30 feet or more.

Often the water level falls prior to the arrival of the tsunami wave, luring the curious on to the beach. Bad idea. If you see a sudden retreat of the water, RUN as fast as you can to higher ground.

Not only do we have truly excellent simulation models of tsunamis, but we have much better data on water height as well. Specifically, there has been an increase in the number of DART tsunami buoys. The number of DART buoys (see graphic below for map) was greatly increased after the Indonesian tsunami, with some of our local legislators (particularly Congressman Jay Inslee) playing an important role.

Here is the data from the Dart buoy near Hawaii. You can see the regularly varying tidal variations during the previous days, and the major changes during the last day due to the tsunami.


Regarding radioactive release in Japan, nothing to worry about. Even if there was a MASSIVE release there, it would be utterly diluted by the time it reached us.

Good Blow

| comments

As advertised, we had a nice, little windstorm today. The satellite image at 10 AM was beautiful (see below). The low/trough was within the hook-shaped clouds. We call this feature a bent-back occlusion or warm front and the strongest winds are generally on the western and southern portions of the hook. One rakish research paper calls this "the poisonous tail of the bent-back occlusion."

The central pressure of this low was not that impressive (perhaps 996 mb), but the track was perfect to give us the best such a modest system could muster.

Strongest winds were 60 mph in North Bend and 56 mph on Alki (which had the advantage of being surrounded by low-friction water). Many locations had gusts between 40 and 55 mph and several thousand people lost power. Kind of amazing to me that there are still trees and branches to come down after all the wind events we have had this winter.

Sitting in my house now I can hear the gusts... If you want to see some neat videos of today's winds...take a look at the video interface on the right of the blog.

One of the most dramatic events today occurred as the low moved inland and air surged eastward into the Strait. The leading edge of the strong winds often has very heavy precipitation, since the surging flow pushes the air in front of it upward. Here is a radar image at 5:35 PM showing how this looks. There are red echos in there...really pouring.


And take a look at the winds at 6 PM (below)....40 kt sustained winds at some surface locations. I would not want to take the Victoria Clipper today! (click to get big image)

Heavy Rain

| comments

Some amazing rain today...here is the radar image at 9:56 PM tonight...wow...lots of yellows--that is all heavy rain. It is pounding on my roof right now.


And today with the front there was a very intense rainfall band crossing the Sound around noon...here is the radar image. If you look closely, there were some reds in there....a downpour, probably with some small hail mixed in.

You might be interested in the quantity you are looking at in these images...they are reflectivity--a measure of the scattering of the microwave radiation emitted from the radar. The units are dbZ. You know about dbs on your sound system (db stands for decibel)..a logarithmic system for noting sound volume. This is a logarithmic scale for radar reflectivity.

5-10 greys-light mist or drizzle
15-25 light reds or pinks--light rain
30-35-moderate rain...greens
40-45 -heavy rain...yellows
Above 50--either absolute pouring or hail (reds)

Here is the rain over the past 24-hours from Seattle Rainwatch...some locations have gotten 1.5-2.5 inches today. Nice rainshadow.

Cold and Wind

| comments

Look at the temperatures over the past four weeks: Today, was the first day since mid-February that we reached the normal high....three weeks! February was the seventh coldest at Sea-Tac since 1948. I suspect that if we looked at the period from Feb 15 though March 7th, it would be in the top three cold years at this location.

A series of storms is now on tap and the first one is off our coast. Here is nice infrared satellite image this evening. Infrared (IR in the business) pictures tell us how much infrared radiation the earth and clouds are radiating in a certain wavelength range in which the atmosphere is relatively transparent (called a window region). For IR images the wavelengths observed are typically 10-12 microns.

Cold clouds are shown as white, warmer objects dark. Since temperature usually decreases with height, cold clouds are generally high and vice versa, so we can tell the height of clouds with such imagery.

You see that well defined hook? The low center at the surface is right in the middle of this. And the cold front is associated with the long narrow cloud feature extending to the south.

This low center will move up the coast west of Vancouver Island..so no major windstorm here.... (see graphic for pressure pattern at 10 AM tomorrow)...

but there is another behind it for Thursday and this one is coming in much closer. Strong winds are in the cards with the next system. Remember the general rule of thumb: to get strong winds over Puget Sound the low center must cross the coast between the NW tip of the Olympic Peninsula and the middle of Vancouver Island.

Good News and Bad News

| comments


The good news for some is that there is little chance of lowland snow for the next week, which probably means we are out of the woods on that. Lowland DOTs can relax. The bad news for some...the faucet is about to be turned on.

Interestingly, although the last month has been substantially cooler than normal (consistent with La Nina!), we have in fact been drier than normal. (see graph for Seattle...blue is normal) That is going to end.

Now tomorrow will be pretty much dry, but then we will experience a series of storms...and I mean a lot of them during the next week. The flow pattern will be generally southwesterly, with the jet stream and moist southwesterly air headed our way. (see upper level map for an example).Not a major flooding situation, but just persistent moderate rain, with storms every day or so.

Want to see? Here is the precipitation for the next 48h.
And here is for the next 48 h. Quite a bit wetter, with some mountain locations getting 2-5 inches of precipitation (multiply by roughly 10 to get snowfall amounts).

And here is another 48h:
The spreading moss on my lawn will be very, very happy.

The air mass will be cool enough that most of this precipitation will fall as snow in the mountains...which is great for skiers and for the water supply.

Endless Spring

| comments

The weather will be quite benign the next few days...downright boring after all the action of the past month. I don't want to jinx anything, but we are now entering northwest spring.

In the eastern part of the U.S. there are frequently big storms in March---remember the old saw of March coming in like a lion and going out like a lamb? For us, March should be replaced by February.

In our area, major storms in March---big floods, big windstorms, major lowland snowstorms-- are very, very rare. For all intents and purposes we should be done with winter. Jim Forman will be able to send out his yellow jacket to the dry-cleaners, and switch to fires instead of weather.

But we pay for our early spring in a strange way...it never ends! Our spring often lasts into early July, while in the east summer-like weather starts in May and June. The standing joke at the Seattle National Weather Service office is that summer starts on July 13th (or something like that). And that is not half wrong.

Getting back to the current weather...here is the latest visible satellite picture:
Unimpressive convective clouds offshore, a weak convergence zone in the north Sound, and upslope clouds (and a few showers) over the Cascades. And real clear over the Tri-Cities (those folks know how to enjoy their sun!). The radar is also unimpressive..a few showers in the convergence zone and on the windward side of the Cascades.

With several feet of new snow this week, our snowpack has made a wonderful recovery. Here is the snow-water-equivalent...the amount of water in the snowpack compared to normal. We jumped from 50-60% to 89-90% in the central Cascades and above normal over the Olympics. Water is not going to be a problem this summer and fall. We have it in the bank!
Here are the precipitation forecasts for the 24-h ending 4 AM Sunday and Monday.
You see the showers for today (not very heavy) and the generally dry conditions on Sunday. Except partially sunny skies west of the Cascades today and lots of sun tomorrow. Sunday will be extraordinary for skiing and snow fun in the Cascades...loads of new snow and great weather. And the roads will be fine.


Support : Creating Website | Johny Template | Mas Template
Copyright © 2011. The Weather - All Rights Reserved
Template Created by Creating Website Published by Mas Template
Proudly powered by Blogger