Boring Weather

| comments

The media loves to highlight extreme and exciting weather, but they have missed a critical opportunity:  to describe perhaps the most important extreme of all-- extremely boring weather.

Where in the U.S. are folks experiencing the same, dull weather, day after day?  How dull can it get?

You won't find coverage of this topic on CNN or your local news channel, but this blog pushes the envelope on such important matters.


The first stop in our boring weather tour will be Los Angeles, where the high temperature of the PAST SEVEN DAYS has been either 70 or 71F!  And the peak winds have have hardly varied in speed and direction.  Dullsville.


Or San Diego the last week.  A real snooze, with highs of 72 or 73F each day, no rain, no nothing.


But if there was an Olympics of weather boredom, we need to look closer to home, where the gold medal of weather uneventfulness goes to North Bend, Oregon, where the average temperatures over the PAST MONTH have ranged from 58 to 62F, and the max temps from 63-68F.


This is pretty bad....but surely the forecast suggests some excitement for the good folks of North Bend!  Here is the latest prediction from the Weather Channel.  Yikes!  The highs range from 62 to 66, partly cloudy every day, with a 10-20% chance of drizzle!


You ask why is the weather so BORING over the West Coast during summer?

The answer is clear...we have a cool Pacific Ocean offshore that doesn't change temperature much.  Onshore flow of marine air at low levels.  The jet stream and weather disturbances are far to the north.  High pressure offshore and few thunderstorms.  A deadly period of meteorologists...

Boring satellite image...some low clouds over western WA (surprise!) and along the central and southern CA coast (another big surprise).  Sunny in eastern WA and the interior of CA (more surprises).  Low clouds offshore.


Climate Extremists

| comments

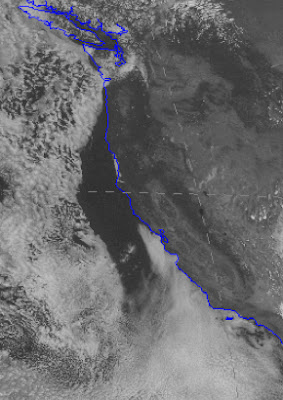
On March 11, 2011 a wall of water, reaching 130 ft high in places, struck the Japanese coast causing extraordinary devastation, including nd extensive damage to the Fukashima nuclear power plant.

Should we blame this disaster on global warming? 

Certainly, the warming of the earth, caused by both natural and greenhouse gas forcing, has caused sea level to rise, with increases of about 10 cm (4 inches) since 1970, roughly when human greenhouse gas forcing became significant.


The answer to the question above is clear: human-caused greenhouse warming may have added a few inches to the height of the water surface, but the great tsunami was caused by an extraordinary natural phenomenon (the Tohoku earthquake), and the impact of sea level rise was really in the noise level.

The reason I mention this example, is that a number of folks are twisting essentially the same situation, but in the atmosphere, to make the case that global warming is making the weather more extreme.  They cite the latest weather/climate disasters as proof:  the current heat wave/drought in the Midwest, the Russian Heat Wave of 2010, the Hurricane Katrina in 2005, the list is endless.  And headline-thirsty media are happy to amplify this message, to the detriment of their readership.


So what is causing the big weather events we are experiencing?   The most frequent reason is an amplification and locking of the upper level flow pattern that controls the weather.  Most of you know about the jet stream, the current of strong winds in the upper troposphere, a feature associated with storms in the midlatitudes.  The jet stream and upper level flow generally has undulations, with troughs  (when the jet stream moves south) associated with cool, wet weather and ridges (when the jet stream moves northward) associated with warm dry weather.  In fact, there are two jet streams:  one in the midlatitudes and one in the subtropics (see picture)

We often show the upper-level flow patterns by displaying the height of pressure surfaces in the atmosphere, often 500 hPa (see below).  You can see the troughs and ridges on this chart (trough lines indicated by dashes).  Now much of the time the troughs and ridges move through (generally from the west to the east) and we get "normal" weather... sunny days interuupted by cloudy, rainy ones (or snowy in winter).  The figure show such a situation.


But sometimes the atmosphere "locks up", with a ridges or troughs staying in one location and increasing in amplitude.  This  locking up is often termed blocking.  Blocking is not well understood, sometimes we can figure out why it is happening, but often we are clueless.  In fact, blocking can happen quite naturally as part of the non-linear, complex physics of the atmosphere.

Many of the extreme weather situations are associated with such locking of the atmosphere.  Why has the middle of the U.S. experienced apersistent heat/drought and the West Coast has been cool and wet?   You guessed it--
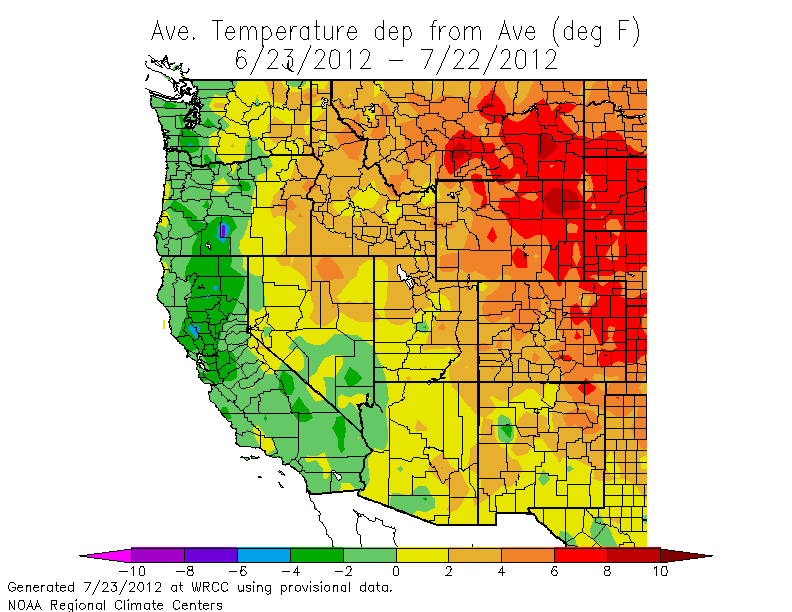
the upper flow pattern has been locked in a configuration of a ridge over the central U.S. and troughs along the coasts. Here is a sample of the pattern from late June.


Take a look at the departure of the average temperatures from normal for June and the last two weeks when this configuration has been in place.  You see that some of the differences from normal (the anomalies) exceed 9F!.


These are very large anomalies, and FAR exceed that signal that  thescientific community believes might be associated with human-caused global warming over the past 50 years (perhaps 1 F).

You see how this is like the Japan tsunami?  Sure, global warming might be making things a bit warmer, but these major weather/climate events are clearly associated with natural variability.   Global warming...and particularly warming caused by humans...plays a VERY minor role.   This conclusion, for the current heat wve and other events like the Russian heat wave,  is supported by a number of scientific reports, including some very well known scientists at NOAA (an example here).

Now, some of you may ask, could global warming due to human greenhouse gas emission be increasing the amplitude and "locking"  of the upper waves?  There is absolutely no evidence of this.   Some climate model studies, suggest the opposite....that blocking and weather anomalies might DECLINE as the earth warms (see article here that discusses this issue).  So the weather might get LESS extreme.  Other models indicate a slight increase in blocking.  

There is little doubt the earth is warming from a combination of natural and human-induced effects and that the number of high temperature records are being broken as a result (and as result of urbanizaton and poor instrument siting).  But the evidence suggests that  the big weather/climate events have little to do with global warming.

Reading the media and scanning the press releases of environmental advocacy groups, you would not come to these conclusions.   Some organizations, like Climate Central and extremists like Bill McGibben,  hype every major weather anomaly as proof of the profound effects of human-induced global warming.  They ask you to "connect the dots"  but are playing a very unhealthy role in this issue by providing false information.  The trouble is that the media feeds upon this stuff...and my local paper..the Seattle Times....is one of the worst.  Even more embarrassing, national pundits with little climate or meteorological knowledge...like Paul Krugman...are parroting these unproven ideas.

I really appreciate Paul Krugman, but this is really embarrassing for him
The psychology of those hyping extremes is worthy of study and analysis...but I suspect the reasons are clear.  Many are convinced, as they should be, that mankind will have a large impact on the climate of the planet by the end of the century because of our enhancement of greenhouse gases.  Plus, acidification of the oceans.  They believe by hyping the relatively small impacts during the past few decades that they can motivate people to act.  A lie for a good cause.    And yes there is the human side--folks love attention and feeling important...and the media is happy to provide this for those telling tall tales of huge current impacts.
          
I know that a few will jump on me about not mentioning the deceptions of the "other side."  And they are legion.  There is whole climate change denial lobby... funded by energy firms, the Koch brothers, and others... and supported by large group of folks that believe that conservatism and conservation are not compatible, saying that greenhouse gas impacts are an unproven theory, and that natural variability is the only game in town.  They are wrong.   The science is clear: human-induced warming will be a profoundly serious issue for our civilisation by the end of the century.  And the polititicizaiton of this scientifc issue has become very unproductive.

If you believe in the seriousness of global warming in the future, it is essential to stick to the truth.  Over-the-top claims--which are easily provable to be false or which will fail to materialize in the near future-- simply undermine the credibility of the science. Mankind can only make the right decisions if they know the truth...and the uncertainties, and there are two groups in this conversation that are doing much to prevent the public from understanding the nature of this serious problem. 


Summer SuperFog

| comments

 Coal Train Update

     Last night (Thursday) Professor Dan Jaffe, myself, and some students took observations of particle levels at Richmond Beach Park in Shoreline on the bridge over the track.   The goal was to determine what was coming off the coal trains.  We sampled several freight trains and one coal trains.  A video showing this fun is found at: http://www.king5.com/video?id=163980306&sec=549122

Thanks so much for those providing information about coal train passage.  We are going to do this multiple times and will let you know what we find.  For those living near the tracks, how often are there trains in the morning?

..........

It is relatively unusual, but we have late July dense fog over the south Sound...dense enough that it delaying some flights at Sea-Tac.   Here are the latest observations at the airport. Quarter-mile visibility on the runway. 


Here is the latest Sea-Tac cam shots:


Says everything, right?  Or the view from the KING-5 tower cam on Queen Anne Hill.   Poetic.


Even the roadways are being affected...here is I5 near S 200th St.

You can see the low clouds and fog from the latest visible satellite image.   The clouds are covering the cost and much of the lowlands...head up and you are out of it....or just go north of Seattle.


The low clouds and fog will rapidly burn off this morning.

By the way, if you are really into low clouds, the National Weather Service has a marvelous new web page showing cams along the coast (http://www.wrh.noaa.gov/sew/bars_mover.php).  As you mouse-over locations you see the cams along the coast.
You can get you fill of low clouds from the comfort of your home.


Asian Haze is Back

| comments

Looking towards the Cascades this morning, much of the detail is obscured and Mt. Rainier is barely visible from Seattle (see image).


And viewing the number of particles in the air from the local air quality network shows an increase in obscuration (this data is from a device called a nephelometer and show the number of small particles).   I have plotted the results from a number of local cities.  They are all heading up.


Why do I think this is from Asia?  One reason is the lastest results of the European Center for Medium Range Forecasting biomass smoke trajectory model, which indiates that some of it is getting across the Pacific (see graphic).


And where is the air over us coming from?   We can compute air trajectories in time to find out!  Here is the answer: from lower levels over Asia, where many fires are still burning (see graphic).  We will be living with this Asian smoke for most of the summer.


It is sobering to contemplate the interconnectivity of the natural environment.  Smoke from Asia (and other pollutants like ozone) can make it across the vast Pacific and obscure our mountains and degrade our air quality.  A tsunami in Japan results in debris reaching our coast.   We ship coal to China and the CO2 from burning it reaches our shores in days.

PS:  The many weather action during the next few days should be convection (thunderstorms) over the Cascades.   Watch as the cumulus develop over the morning hours and blossoms during the afternoon.  And be prepared for a shower if hiking.

Answering the Complaints

| comments

There has been a lot of griping about the weather this summer, with a number of you asking whether lousy summers are the new normal.

Well, let me try to convince you that this summer is really better than last summer....


Let's begin with comparing the temperatures at Sea-Tac for the past four weeks with those of last summer.  The first image is this summer and the second, 2011 (reminder the continuous red and blue lines the slope upward to the right are the average max and min).
For this year, we had 15 days whose high reached at or above the average high during the past four weeks.  And 13 days that dropped to our below the average min.  Warm period in early July.  Some cool days lately.  OK, nothing to rave about.
But then we have 2011.  Folks this is really bad.  Only 7 days reaching the average max.  Weeks of cool temperatures at the end of the month. 19 days hitting the average min or below. 
 But what you may not know is that eastern Washington has had a much better summer, with exception of the many thunderstorms.  Here are the Pasco temps for last year for the same period.  Very few days got to their normal high and MANY days dropped well below the normal minima.  Not good for our vineyards!
But take a look at this year.  MUCH better.  Many days reached the normal max and for fewer nights were cool.  A very normal year.
 Take a look at the temperature departure for average over the western U.S. (graphic below).  A bit cooler than normal west of the Cascade crest and down into western Oregon and all of CA.  But cross the Cascades and slightly above-normal temperatures beckon.  Why Lake Chelan and other resort areas in eastern WA aren't taking out full page ads in the papers, I can't figure.  East of the Rockies, torrid and dry.


Well, perhaps this is why tourism is not booming in Moses Lake.  Here is the percentage of average rainfall for the past month. Western Washington and NW Oregon have gotten around 150% of normal, but the east side has received 200-400+% of normal. The reason..the thunderstorms.  And I mean a lot of them.


With plenty of rainfall, a great snowpack for water supply, normal temperatures, and lack of killing spring frosts, our agricultural friends in eastern Washington should have some very good harvests.  Which is fortunate considering the negative impacts of drought and heat over much of the nation.

And remember, last summer, as cold as it was during the first half, was quite warm at the end...warm enough that I had a bumper crop of tomatoes! 

NEW UPDATE:

Gov. Chris Gregoire on Monday proclaimed a state of emergency for 16 Washington counties hit by last week's thunderstorms.

The Tropical Connection

| comments

Thursday and Friday brought extraordinary thunderstorm activity to the Northwest, with torrential rain hitting both sides of the Cascades.  I can not remember such a period of such sustained summer convective activity in our area.

It turns out that there is a tropical connection to this outbreak, a fact noted to me by Dr. Jim Steenburgh, an ex-Husky who is a professor of atmospheric sciences the University of Utah and probably the greatest booster of Utah snow in existence.  And he has a wonderful weather blog (Wasatch WeatherWeenies)

Let me warm you up (or wet you down) by showing a plot of 24-h rainfall ending 9 PM on Friday (see image, click to enlarge).   Loads of places over the Cascades and Okanogan highlands got over 1 inch...some close to 2.  Here in Seattle 3/4 inch totals were plentiful...that is more than our normal MONTHLY rainfall.


As mentioned above,  yesterday's plentiful precipitation was juiced by cool moist, unstable air moving northward out of now defunct Hurricane Fabio (see an image below from a few days ago)


 Let me show you a sequence of satellite images from the water vapor sensor on the GOES geostationary weather satellite run by NOAA.  Water vapor imagery shows you the amount of moisture in the mid to upper troposphere--the lower layer of the atmosphere.  You will see how the moisture streams northward (white and greens)


There was also a modest feed of moisture at lower levels from off the Pacific...a weak "atmospheric river" type structure.  You can see this from the simulated vertically integrated water vapor from the WRF model (red, white and blue are the most H2O):

 Pulling this all together was a strong upper level trough, which provided upward motion and southeasterly flow (helping to pull the topical moisture up to us).  Here is the 500 hPa chart for mid-day Friday:

Mamma Mia...that's a nice summer trough!

  Everything came together to give us moisture, instability, and lift....the ingredients for robust summer convection.  And we probably won't see any more of that for a long time.

Tomorrow a strong closed low will reach us and clouds/cool temperatures will return for a few days.  Showers coming in later tomorrow and into Monday...sorry.

Flash Floods Hit the Northwest

| comments

 7 AM Friday Update:  Forced by an upper level trough, heavy convective showers are now moving through western WA (see radar).  Should continue through the morning and will dry out by mid-afternoon.  Saturday relatively dry with morning low clouds.  More on KPLU at 9 AM and then online at www.kplu.org.


 East of the Cascade crest, heavy thunderstorms have caused a series of flash floods and more thunderstorms are on the way.  Eastern Washington and Oregon are quite vulnerable to such storms, and one of the great flash floods in U.S. history---resulting in the deaths of hundreds--occurred over northwest Oregon in the town of Heppner (in 1903).

Why the vulnerability?  Eastern Washington and Oregon get a fair number of thunderstorms each summer and some can bring an inch or two over one hour.  Then there is the geography--lots of valley and canyons where water can concentrate and an arid landscape that has not adjusted to heavy rainfall.  Plus, folks unaccustomed to heavy rain and the proper response.

Over the past few days there has been wave after wave of thunderstorms striking eastern WA/OR communities and some of the precipitation has been torrential.  For example, a thunderstorm hit the Okanagan area near Omak around 2:30 PM Sunday afternoon, with over two inches over a one hour period  at the Malot AgWeatherNet Station. That is an extraordinary intensity.  Take a look at the radar at about the same time....the reds are very heavy rain.


 The result was a flash flood and debris flow that closed SR 97.  Click on the picture to view some video of it.

http://www.youtube.com/watch?v=LhrafGhN0FI
Another flash flood struck the Yakima River Canyon, the site of several other such events, during the evening of July 17th,.  The result was a debris flow the close the Yakima Canyon Road for hours (see image).

Clearing Yakima Canyon Road
The radar image about the time of the Yakima downpour showed several very intense cells....and they were not moving quickly:


An even bigger event occurred on July 3, 1998 when 3-4 inches fell over the Yakima Canyon area over only an hour...massive slides occurred than severely damaged Yakima Canyon Road (SR 821) and trapped motorists before they were rescued. (I discuss this event and the Heppner flood in my book on NW weather)

The greatest flash flood in Northwest history and one of the top events for the entire U.S. occurred in Heppner, Oregon in 1903.  Located in a river drainage on the northwest slopes of the Blue Mountains, this event was caused by a summer thunderstorm upstream from the town.  Before it was over more than 230 individuals lost their lives. Joann Byrd wrote a good book on this disaster called Calamity (info here).


Heppner Oregon after the flash flood

Some good advice...if you are living in a river canyon and it is thundering and pouring outside, get dressed and head up any nearby slopes.  Moving a few hundred feet uphill can make the difference between life and death.  And NEVER drive through a flooded road.

More thunderstorms developed over Oregon this afternoon and they are moving northward in Washington as I write this (around 9 PM Thursday)--and there should be more tomorrow morning.

Here is the latest radar image....the thunderstorms are apparent...with a strong one


approaching the south Sound.   The National Weather Service has a flash flood watch out for much of eastern Washington and northern Idaho (see image)--so if you live in these areas...be watchful.


Tomorrow morning I'll be talking more about this topic on KPLU at 9am, and my discussion will be posted here (http://www.kplu.org/term/weather-cliff-mass). (This is the kind of discussion you won't hear on KUOW!)

Finally, as many of you know the final movie in the Batman saga...Dark Knight Rising...will be hitting the theaters this weekend (I am going!).  Batman is essentially out of work in Gotham City is looking for another way save mankind-- it appears he is interested in changing the face of weather forecasting.  Why do I say this?  Check this out to view his practice tape for Washington D.C. TV station (click on image to see his dramatic presentation):

http://www.youtube.com/watch?v=lffNusCccpE


Support : Creating Website | Johny Template | Mas Template
Copyright © 2011. The Weather - All Rights Reserved
Template Created by Creating Website Published by Mas Template
Proudly powered by Blogger