KUOWGATE, July 4th Weather, and a Radar Animation

| comments

There is some serious wind tonight--with gusts to 20-30 mph as an upper trough moves through. Almost blew me over on my bike today.

Tonight, I wanted to talk about the most serious aspect of the KUOW affair: the extraordinary willingness of the station to spread incorrect information to defend itself. But considering that some of you are not interested in this, I decided to put it into a separate blog:

http://kuowgate.blogspot.com/

This week the National Weather Service sent me a marvelous video of the construction of the new Langley Hill radar. Check it out here:


I love the part where they build the dome and put it on top of the tower!

July 4? Looking good! Tomorrow (Thursday) will bring lots of clouds and some showers, particularly in the convergence zone and along the western slopes of the Cascades. Friday and Saturday should be sunny and warm. Sunday--clouds and perhaps some showers...and then major improvement on July 4th... just in time for picnics, parades, and illicit incendiary activities.
     But let me give you some good news, particularly since the front page of the Seattle Times on Thursday talks about the dangers of snow on our trails.  It really looks that we are going to transition to true summer weather next week.  Here is the National Weather Service 6-10 day forecasts for temperature and precipitation--higher probability of warmer than normal and drier than normal weather.  More on this on Friday....

Why Some Forecasts Don't Work Out and What We Can Do About It!

| comments

Today was a generally warm, cloudy day with occasional light sprinkles and showers, quite a contrast with what was predicted only a few days ago. The high today at Sea-Tac was 69F with a trace a rain. More rain fell over the south Sound and the coast.

Lets take a look at the National Weather Service forecasts for Sea Tac and vicinity provided on various recent days around 4 PM:

Friday: MONDAY...MOSTLY SUNNY. HIGHS IN THE 70S
Saturday: MONDAY...MOSTLY SUNNY. HIGHS MAINLY IN THE 70S. LIGHT WIND. Sea-Tac: 79F, 10% chance of rain (they mean measurable rain--at least .01 inch)
Sunday:MONDAY...MOSTLY CLOUDY. HIGHS MAINLY IN THE 70S. LIGHT WIND. Sea-Tac 75F, 10%

and this morning (Monday) at 4 AM the NWS was going for clouds with 75F at Sea Tac and 10% chance of rain.

We ended up with a cloudy day, with some sprinkles over most of the area and light rain in some locations. Upper 60s and low 70s.

So what changed? As I will discuss below, this was a difficult forecast, with the region right on the edge of big rain gradient...and the forecast models had quite a bit of uncertainty.

Here is the 24-h precipitation forecast from the UW prediction system starting at 5 AM this morning (and thus ending 5 AM on Tuesday morning). Not too bad. Shows the heavier showers on the coast and over SW Washington. But this is a very short forecast and we expect it to be excellent.


Now here is the forecast for the same period (24 h ending 5 AM on Tuesday) that was run at 5 AM Saturday. Big difference, the precipitation was well off the coast.

And here is the forecast starting Friday morning: same thing.

Now what changed? The flow field aloft was just subtly shifted between these forecasts..and that made all the difference between sunny and mid to upper 70s and cloudy, lower 70s/upper 60s with sprinkles. Lets take a look.

Here is the forecast from Friday for the upper level (500 mb) flow. See that low right off our coast? Pretty unusual for this time of the year.


And here is the same upper level flow from this morning's forecast (which should be very close to reality). Can you see the difference? REALLY subtle.

This is an example of a very difficult forecast situation in which the outcome is very sensitive to small differences in the forecast flow field.

So how can we deal with such a uncertain forecast? Well, meteorologists now have a new tool--ensemble forecasts: running many forecasts each starting a little differently. Half of the forecast show rain, half not...50% chance of rain! Having a variety of different forecasts...all very reasonable..makes it more likely that the forecast system will capture an upcoming change. Here is an ensemble forecast starting Friday afternoon at 5 PM, showing the 12-h probablility of precipitation during the day on Monday:

This guidance gave a real heads up that there would be a significant chance of showers on Monday. This is the future. And forecasts will be more useful because of it.

Olympic Snowpack is 39,100 Percent of Normal!

| comments


I took a look at the latest snowpack report today and was stunned!

As reported by the U.S. Department of Agriculture's Natural Resources Conservation Service the Olympic Mt. snowpack (actually the total snow water equivalent--SWE--of the current snowpack) was nearly four hundred times normal. Here is the official map (click to on it to enlarge):

Most of the snowpack measurements in Washington were 200 to 600% of normal, and Oregon and Idaho had similar values--some into the thousands of % of normal. Montana has several basins into the thousands.

Now having snowpacks tens or hundreds of times normal does not mean we had tens or hundreds of times more rain or snow last winter; normally there is very little snowpack left this late in the season and thus having a substantial snowpack can give you very large numbers (where snow is usually melted off completely you could get infinity!). But no matter how you cut it, we have an amazing snowpack for this late in the season.

Why so unusual? We started with a very good spring snowpack after a cool, wet La Nina winter, and one of the coolest springs (now summer) on record is allowing the snowpack to remain. To illustrate, lets look at the temperatures at Stampede Pass at roughly 4000 ft in the Washington Cascades over the past four weeks and compare those temperatures against the normal highs and lows:
Only a a handful of days got above normal and most never even got close to the normal highs. On many days the high temperatures barely reached the average lows!

This kind of substantial late season snowpack provides a serious flooding risk, so it is good that we are not warming up quickly. A major heat wave situation would cause a number of rivers to overflow their banks--particularly overthe eastern slopes of the Cascades. I should note that the northern Rockies have a huge snowpack as well and the melting of that snow is resulting in historic flooding over the Dakotas right now.

We should not forget that the large number of dams on the Columbia not only provide hydroelectric power and water for irrigation, but they serve a flood control role. This week I was talking to a meteorologist at the Bonneville Power Administration and he said that their calculations indicated that without the dams, Portland would have had substantial flooding starting two weeks ago. Before the dams went in, major springtime floods were not unusual on the Columbia. The most dramatic example was the Vanport, Oregon flooding in 1948.

Vanport was a town on the Columbia River near Portland that was flooded and essentially destroyed, killing 15 and leaving 6000 homeless (see pictures bel0w). A huge snowpack had built up in the mountains, and warm temperatures leading up to the Memorial Day weekend initiated a surge of floodwaters moving down the Columbia--with few dams to intercede and stop the waters (check my book for more details on this event)

So we should hope for a slow warm up--and there will be plenty of water for irrigation and hydroelectric generation this summer.

The irony of the current situation is that it not only is good for hydropower but for wind energy as well. As shown in visible satellite imagery, almost every day this spring (like today--see below), the western side has been inundated with clouds and cool air,

while the eastern part of the state is warmer and sunny. Cool air is associated with high pressure, warm air with low pressure--and thus we have a large difference in pressure across the Cascades. Air rushes through the Columbia Gorge and through gaps in the Cascades, right into the major windfarm projects. Thus, this is a very good year for wind power as well.

The problem, as discussed in the press, is that there is not enough transmission capacity for all this clean, renewable power, and as as result the wind farm folks have been forced to feather their turbines, losing large amounts of money in the process. Not good for wind farm owners, probably really good for lawyers.

Iridescent Clouds

| comments

This week I received some wonderful pictures from Patrick McKinnon, showing rainbow-like cloud features over Seattle. Take a look at them!


And over the past year, others have sent me similar pics. What are they? They have lots of colors like rainbows, but they aren't rainbows. And besides there is no rain with them!

What you are seeing is an example of iridescence, with the colors produced by a process called diffraction.

Iridescence is associated with thin clouds of relatively uniform, small, cloud droplets or ice crystals. The colors are generally in the pastel range. This phenomenon is most obvious in cirrocumulus, altocumulus, and lenticular clouds (lens-shaped clouds formed by flow over mountains and in their lee).

The source of the color is the same as that produces the colors in soap bubbles and oil slicks on the road--diffraction.

Diffraction depends on the wavelike nature of light. Sunlight is made up of all wavelengths of the visible spectrum and in diffraction, the colors are separated by light interacting with itself--called constructive and destructive interference. In a future blog I will go into this mechanism in more detail.

KUOW and Its Listeners

| comments

Note: One month ago my 5-minute weekly weather segment was cancelled on the UW public radio station after doing it for 15 years. The reason--I would not absolutely guarantee never to talk about anything other than the weather forecast. I had an earlier blog describing the lead up to this situation: http://cliffmass.blogspot.com/2011/05/no-more-weather-on-kuow-weekday.html This blog provides more information. My next blog will be back to weather!

Its been a month since Steve Scher ended my weather segment on KUOW, so I thought it was time to provide some reflections on the incident.


As I will describe below, the importance of KUOW's actions extends far beyond the five minutes of weather information I provided each week ... the termination itself, the interactions before it, and the troubling reaction of KUOW afterwards says a great deal about the management of KUOW and their responsiveness to their listeners.

Some of you suggested that I simply forget about the whole thing---the few minutes I had each week were a relatively small part of my life, I have my
blog, and it will by easy for me to find another radio station to work with. But those five minutes were of importance to a great number of you (based on the reaction that still amazes me) and the actions of KUOW reveals so much about what KUOW has become. There are serious issues that need to be addressed, and I will discuss a number of them in this and subsequent blogs. I suspect one reason that the reaction was so substantial was that many intuitively sensed that there was something very wrong when a public radio station removed an individual for having a different view of the nature of public radio then a program host---public radio is supposed to be all about airing of divergence views and the program advertises itself as a venue for such animated conversations. And perhaps there were other misgiving about changes in KUOW that this incident gave people the freedom to discuss.

The whole situation is in many ways surreal---the initiator for the whole firing was my (a UW professor) defending UW admission's policy with facts agreed to by the UW Dean of Admissions on the UW's public radio station on an opinion show--Week in Review. Not math education as claimed by some KUOW press releases. Folks, it doesn't get more bizarre than this.


One of the most striking aspects of my situation with KUOW was the lack of interest in what listeners wanted and cared for. During my discussions with Weekday Host Steve Scher and his producer Katy Sewall they opined that my talking about math/science education (always with their permission I add) were somehow inconsistent with KUOW’s “journalistic principles” and that my segment would end if I ever talked about such subjects again. I countered with a number of arguments (like the fact that Rick Steves and many other regulars talk about all sort of things) but they were adamant. I asked them about the needs and wishes of the listeners, who obviously liked both the weather and other topics. They didn’t care. And I agreed never to talk about those education matters and never did again.

Now this disinterest in listeners wishes became even more obvious after the “firing.” Five thousand signatures, several thousand emails, and one-side polls by the Stranger (only 8% of roughly 1500 people agreed with the dismissal), and thousands of friends on Facebook pages asking for my return—it didn’t matter to KUOW. I talked to Jeff Hansen, the program director a few days after my release. I asked him explicitly—wouldn’t all that feedback be reason for us to sit down and figure out an approach whereby my weather segment could be saved, perhaps with another host. He said no—it did not matter (in fact he noted that explicitly on a statement he put up on their web site, which they changed a few days later!). I asked, if there were 10,000 or 20,000 signatures, would that change his mind?…..he said no. The number of listener supporters did not matter. That really took me aback—this from the Program Director of OUR local public radio station.

A day later I was interviewed by KUOW’s Debra Wong, who was doing a “news” story on my firing (this seemed really inappropriate to me—and the final story WAS highly skewed). During the interview we talked about the huge listener reaction to my firing and she asked---“Why should KUOW care?—a few thousand listeners are only a small proportion of our weekly audience” I was really shocked by this comment….and you could tell she really meant it.

She also told me something else--- an analogy given by Steve Scher when she interviewed him. Steve said the program was like a house---his house. When a guest acted badly, it was very reasonable to kick him out. (Its interesting that she didn’t mention this statement on her radio segment). But I think Steve's analogy was not a good one. This house is owned by the University of Washington. The people (renters) who live in the house and PAY ALL THE BILLS are the listeners and sponsors. Steve is more like the gardener, who is paid by the renters to keep one section of the house (the garden) pleasant to look at. He is an employee—someone who has been tending the garden for a LONG time and likes it a certain way. Now what about me? Originally I was brought in by gardener Steve to do something special in a section of the garden (for free!). The owners really liked it and befriended me. And when I wanted to alter my plot a bit in a way the old gardener was not comfortable with, well you know what has happened. Now how do you think the residents will take it when their EMPLOYEE ejects their friend and tills over the garden section they had grown to love?

I have learned that KUOW is an organization that does not answer to anyone. The UW has a hands-off policy and will not intervene. I know this, because I asked the relevant UW official to intercede before the firing and he said UW would not. I asked Wayne Roth's help (he is the CEO of KUOW), he refused. The KUOW board is a figurehead organization---emails to them by many listeners and myself were never answered.

KUOW doesn’t even have to worry about money. Did you know they had roughly one million dollar surpluses each of the past two years? (see their annual report) If KUOW needs more cash they simply extend the pledge drive or get more “sponsors” for program segments. You notice that some programs now have multiple sponsors and that they increasingly sound like commercials (“this program is sponsored by Joe’s Jaguar who is now selling the new 2011 model with the new hybrid engine and is available for leasing. For more information go to www.JoesJaguar.com). Sound familiar? And multi-week pledge breaks are non-stop commercials for KUOW. This is not commercial-free radio. And saying so is not being factual. As all of you know, the number of money requests on air, in the mail, by email, and on their website has gotten out of hand. They have very, very nice digs they built a decade ago and a very large staff.

Well, enough for this blog. My next blog on this topic (probably next week) will talk about KUOW's misinformation campaign and some suggestions on how KUOW can be changed to serve the critical community role it should.

Several community-created social media sites discuss some of these issues:

http://www.facebook.com/pages/KUOW-Listeners-Speak-Out/206337796069124

http://www.facebook.com/pages/Put-Cliff-Mass-back-on-KUOW/149155005153152

and of course there are the KUOW and Weekday Facebook sites


Summer Weather and Audio Podcast

| comments

A lot of people are asking about the summer. My college-student son Nathan told me that I should try an audio podcast on the topic....so here it is:


Tell me if you like it (he arranged the music!).

Bottom line: Cooler than normal for the next week or so but then we may well enjoy a normal summer from that point on.

One of the major reasons our weather has been cool during the late winter and spring has been the existence of a moderate La Nina. Well, the La Nina has been weakening rapidly and now is basically gone (see sea surface temperature anomalies--differences from normal--in the tropical Pacific shown below). So not only is La Nina basically gone but the correlation of La Nina and El Nino with summer weather around here is very weak.

Looking at the forcast models for the next week it is clear that there is no heat wave in store for us, and we will remain in a generally cooler than normal and cloudy pattern. It is getting to me too. My tomatoes are still alive at this point, but I worry.

The National Weather Service 8-14 day forecasts show a similar forecast--see below. Blue is below normal temperatures (higher than normal probability of cool temps).


Green signifies above normal probability of precipitation:

But you deserve some good news today.

Here is the NWS three-month temperature forecast for temperature---EC means equal changes--which means NORMAL.

And for precipitation, there are even going drier than normal over Oregon and normal over WA.


So just hold on through the July 4th weekend....we may have some real summer yet.

And for those of you interested in my KUOW saga, I am now in serious negotiations with some radio stations and soon I will have an announcement. But I do plan a series of blogs on KUOW and what is going on at that station. There are real issues over there.

Fukushima Radiation and Infant Mortality in the NW? No way.

| comments


Irresponsible environmental scarsters are back.

During the past few days a number of you have emailed me about several media stories and web reports about radiation from the Fukushima nuclear plant causing a 35% increase in infant mortality here in the Pacific Northwest.

The majority of the mainstream media did not go with this story, but a few did, like our local KCPQ (see story here) and other outlets like examiner.com and the well-known Aljazeera.

This was all based on a report by Physician Janette Sherman, and epidemiologist Joseph Mangano that was published online by the "Progressive Radio Network" and by the web site "Counterpunch." In this report they noted that for the 4 weeks ending March 19, 2011 there were 37 deaths (avg. 9.25 per week) but for the 
10 weeks ending May 28, 2011 there were 125 deaths (avg.12.50 per week). They note that "this amounts to an increase of 35 per cent (the total for the entire U.S. rose about 2.3 per cent ) and is statistically significant."

Folks, this is complete and utter nonsense and shows the downside of the web---crazy stuff gets sent around and news-hungry and sloppy media pick it up and give it credibility.

First, the whole premise is silly. That the extraordinarily small amounts of radiation reaching our shores from Fukushima are killing infants through some mysterious mechanism. But it is worst than that...just plain bad statistics!

Here is the their data for the four weeks before and the ten weeks after, shown in black and orange, respectively (credit to this site for the graphs)

The average of the four weeks before (black line) is below that of the 10 weeks after (orange line). This is what Sherman and Mangano were basing their radioactive scare on. But what if we go back further in time to the beginning of the year (see below). The story changes completely!


There is a lot of variability in infant mortality and the period well BEFORE the radioactivity reached us had as high or higher mortality rates as the last few months.

Turns out the four "black" weeks before the release had particularly low mortality. (Perhaps someone should write a paper suggesting that low infant mortality rates cause nuclear meltdowns...makes as much sense as the Sherman and Mangano conclusions.)

Bottom line: those authors "cherry picked" the data to allow them to conclude what they wanted. There are stronger words for such "research" but since this is a family-oriented blog I won't be any more explicit.

Videopodcast for June 17th

| comments

Here is my videopodcast for today.


http://www.youtube.com/watch?v=uZ8gp-Hxh0A

Great day today (Friday) but showers and cooler weather on Saturday. Go to the eastern slopes if you want to hike on Saturday!

I have updated the coastal radar website (see the link to the right). Major progress---the transmitter and receiver are in, power is in, and the antenna assembly and base are being completed. They are clearly ahead of schedule and I suspect the radar will be ready for testing within a month. The National Weather Service is working hard and effectively to make this happen quickly.

A number of you have emailed me about the news stories on the a potential disruption of the solar cycle. I will do a detailed blog about this....but let me note a few facts. First, if you think the skill of weather prediction is uncertain, the skill of solar cycle prediction is worst, as proven by the inability to get this cycle (number 24) correct Second, the variation of solar output from the peak to trough of the solar cycle is relatively small (roughly .1%). Finally, if we keep pumping out greenhouse gases as we have, the global warming signal will completely swamp any solar decline. Bottom line: you don't have to worry about an imminent ice age or cold spell. The best we can hope for would be a decline in solar output giving us a bit more time to get our atmospheric house in order.

You come to this blog for profound insights into the weather.....so here is one...an update of my barbecue index! Scott Sistek of KOMO-TV (who has a wonderful blog) has updated the index to include this year and the results are found here. The barbecue index determines how many days exceed a reasonable temperature for outdoor cooking (59F) since March 11. Anyway, we are the fifth worst year on record. This is the kind of important information you don't hear about on KUOW anymore!

Puget Sound Convergence Zone

| comments

Late spring is the convergence zone time of the year and we have one tonight. Take a look at the latest radar image and you can see the band of precipitation north of Seattle (see graphic). This one is somewhat amorphous--partially because the atmosphere is not that unstable (this gives you a nice line of convection).


Now let me show you something that you won't see on TV tonight..the Doppler velocities for the same time. We don't call it a Doppler radar for nothing! But you never see that on TV.

Funny side story. KING-5 got their own Doppler radar years ago, and my colleague Jeff Renner, excited about it like a little kid on Christmas morn, showed both the reflectivity (precipitation intensity map) AND the Doppler velocities. This did not last long. These Doppler velocity maps are a bit difficult to read. They show you the component of the velocity of the target (here rain) towards or away from the radar--NOT the total wind speed. It takes some experience to really figure out what is going on...and the colors can be confusing. Anyway, here it is:

Makes perfect sense, right? Warm colors indicate flow moving away from the radar, Grey, no velocity towards or away, and cold colors, flow towards the radar. And remember the radar is on Camano Island. So looking a this radar one concludes that there are northerlies over the north sound, and a line of zero velocity--the convergence zone--stretching east-west over Seattle. In general, convergence zone precipitation is north of the low-level convergence line. Well, here are the winds at 9 AM (click to make big). Northwest winds on the coast and a nice convergence zone in the surface wind field. Classic.

Why do Puget Sound convergence zones prefer spring? Because the winds on the coast are more frequently from the west to northwest during this time of the year. In mid-winter, when the flow is more southwesterly, the convergence tend to be weaker and farther northwestward. And the air is generally more unstable during the spring as the surface warms more rapidly than the air aloft.

After the convergence zone passes south of you (with a switch from southerlies to northerlies at the surface), southerlies are usually still aloft. If you look carefully you can see it in the cloud motions. Here is a video for today...see if you can see the differing wind directions right before sunset:


Anyway, if you like Doppler velocities they are always available on the National Weather Service and UW websites, among others.

For those that are in the high tech industry and are located downtown, I will be giving a talk at a Blink open house on high-tech weather prediction on Thursday at 5:30 PM in Seattle. For more info and to RSVP, see: http://blinkux.com/insights/blog/blink-open-house-speaker-series/

And those of you interested in provide feedback to KUOW don't forget, this facebook site dedicated to listener comments:

KUOW Listeners Speak Out

I am now talking to a variety of local radio stations and will be finding a new home during the next few weeks.

Scary Snowpack Stories (Updated June 14)

| comments

If you believe some of the media, this is what is in store for us, very soon!

They're back--the hyped media claims of serious global warming impacts occurring right now. This week an article in Science magazine on long-term western U.S. snowpack reconstructions using tree rings has set media headlines ablaze across the U.S.:

Researchers See Unusually Rapid Decline in Water Source for Western Rivers (New York Times)
"Snowpack in the northern Rocky Mountains has shrunk at an unusually rapid pace during the past 30 years, according to a new study. The decline is "almost unprecedented" over the past 800 years, say researcher"

Study of 800-Year-Old Tree Rings Backs Global Warming (Seattle Times)
" The decline in recent decades of the mountain snows that feed the West's major rivers is virtually unprecedented for most of the past millennium..."

Thinning Snows in Rockies Tied to Global Warming (NPR)

What this paper shows is the warming of the 20th century and beyond is already affecting and will profoundly affect the frequency of droughts in the West, simply by whittling away at the snowpack.--Phil Mote, Climate Scientist at Oregon State University.

Rockies Shrinking Snowpack Hurts Water Supply: Changes in Rockies Could Leave Million Without Water (CNN)

"Pederson said the findings add further context to studies that indicate a 30% to 60% decrease in the snows that gather at the upper elevations of the mountains. ... "It's a two-part story," he said. "In a nutshell, what you're seeing is synchronous, declining snowpacks across the West since the 1980s."

I could provide a dozen more of these stories...but you get the message. And when you read these articles, virtually all go on to pin the blame on human-induced global warming. And before I go on, let me make clear that I am not a global warming denier, but a mainstream atmospheric scientist who believes human-induced global warming is inevitable and a major threat if we don't deal with.

So what stimulated all these stories? An article in Science Magazine that was released last week:

The Unusual Nature of Recent Snowpack Declines in the North American Cordillera By Pederson et al. Here is the abstract:

In western North America, snowpack has declined in recent decades, and further losses are projected through the 21st century. Here, we evaluate the uniqueness of recent declines using snowpack reconstructions from 66 tree-ring chronologies in key runoff-generating areas of the Colorado, Columbia, and Missouri River drainages. Over the past millennium, late-20th-century snowpack reductions are almost unprecedented in magnitude across the northern Rocky Mountains, and in their north-south synchrony across the cordillera. Both the snowpack declines and their synchrony result from unparalleled springtime warming due to positive reinforcement of the anthropogenic warming by decadal variability. The increasing role of warming on large-scale snowpack variability and trends foreshadows fundamental impacts on streamflow and water supplies across the western United States.

In this paper they looked at tree rings around the mountains of the western U.S. (mainly Rockies) and tied their variations to changes in snowpack. Then they show an 800-year chronology of this snowpack and suggest that the recent loss of snowpack is unprecedented in magnitude across the northern Rocky Mountains and the nature of snowpack variations have changed--that snowpack has changed along the entire north-south distance of the Rockies, rather than the north and south being out of phase as they suggest is normal. They further suggest that they in phase loss of snowpack is a sign of general warming: human-caused global warming.

Connecting snowpack variations with a single meteorological value is a tricky business, since trees can respond to variations in temperature, precipitation, insect damage, and human intervention (e.g., thinning or logging), among other things. And problems with tree-ring interpretation was the centerpiece of the recent Hockey-Stick climate controversy and Climategate. But let us accept for the time being that their snowpack-tree ring variation is completely reliable. Should we still accept that scary snowpack tales?

Has there been unusual loss of mountain snowpack the past few decades that suggest rapid human-induced warming? Well, lets go to one of the figures the authors provided in their supplementary information that shows the snowpack (actually snow water equivalent of the snowpack) for the last century for the three areas they talk about--Colorado, Yellowstone and northern Rockies zones. The black lines are based on real measurements of snowpack, the yellow lines are from the tree rings, and the cyan and dark blue lines are smoothed averages of them.

Well, what do we conclude? No real trend in the high upper Colorado Basin and slight downward trends during recent decades (since roughly 1975) from a maximum period in the 50s and 60s. This modulation is consistent with well-known mode of natural variability--the Pacific Decadal Oscillation. And if human-induced global warming is evident it should be after roughly 1970-1980 since before that time our addition of greenhouse gases were too small to have enough impact to be clearly observable.

What about snowpack variations over the nearby Cascades during the past 80 years?A paper published in the peer-reviewed Journal of Climate (I am one of the co-authors) suggests a fairly benign situation:

Since 1976 the snowpack has been INCREASING, and since 1930 the trend is downward by roughly 23%--and much of that could not have been caused by human intervention. As most climatologists know, the earth started to warm after the late 1800s...coming out of the little ice age....and this variation is almost surely natural. Finally, a recently submitted paper by John Christy of U. Alabama, using more snow records than ever before, indicates little loss of snowpack of California during the past century. (see graph)

And here is plot of Snow Water Equivalent (SWE) for Snotel sites from throughout the western U.S. since 1933:

A very slow, fairly steady decline. Nothing abrupt or scary. No real smoking gun for human-induced global warming.

I can show you a lot more snowpack graphs, but the bottom line is that there has NOT been major snowpack losa during the past few decades in the western U.S. and the long-term trend, starting over a hundred years ago, is gently down with some natural variation on top of that.

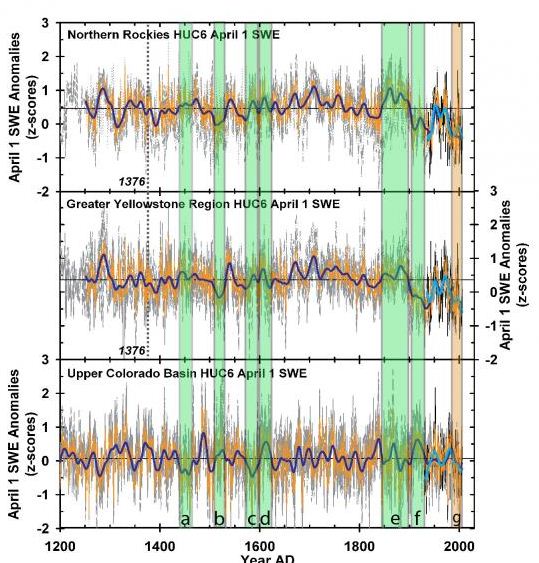
Here is long-term snowpack graph from the Science article--going back 800 years! (below) Not much change in Colorado. Yellowstone and the northern Rockies are lower recently than most of the historic record, BUT THIS STARTED AROUND 1900 WELL BEFORE THE HUMAN-INDUCED SIGNAL WOULD BE SIGNIFICANT.

The other point of this paper is that the pattern of snowpack change has altered during the past few decades--which they ascribe to anthropogenic global warming. As shown in their figure (below) the northern Rockies and Colorado snowpack tend to be out of phase, which they suggest is due to movement of the jet stream north and south, forced by El Nino and La Nina, for example. The shaded areas indicate what they considerto be anomalous periods where the whole Rockies have less snowpack simultaneously. Now the current period of such anomalous behavior is very short---a very few decades--and that could well be just random noise or natural variability. But just as important, is that there are other periods of similar behavior when global warming could not be the reason. Want to see? Here is an example from the early 20th century (see blue shading)

I hope I haven't bored anyone, but I have spent time on this for a reason. If you really check out the Science paper and look at the data, the loss of snowpack during the past few decades have not been serious. There is no clear smoking gun of anthropogenic global warming.

Folks, we are in the early days of the warming and most of the action is yet to come. We need to be very careful on jumping to conclusions too early, since that only aids the deniers and skeptics who are just looking to pounce on excessive claims.

Weekend Podcat and Who is a Meteorologist?

| comments

Here is my weekend podcast--I got a better microphone and increased the cursor size and the field of view...see what you think!


An issue that comes up a lot is: who is really a meteorologist? Are all TV weather folks meteorologists? Do you need a degree?

The U.S. Government is clear about this issue. To apply for a meteorologist position with the National Weather Service or other government agency you need a large collection of physics, math, and atmospheric sciences courses that generally requires a B.S. in atmospheric sciences/meteorology (atmospheric sciences and meteorology are essentially the same thing). There are about 78-80 schools in the U.S. that offer the necessary coursework. Meteorology is really a branch of applied physics and students have to have a lot of math: calculus, vector calculus, ordinary and partial differential equations. Plus physics, plus computer science, plus the whole array of atmospheric sciences classes (atmospheric physics, atmospheric structure, atmospheric dynamics, weather prediction, climate science, etc). And a B.S. only provides a foundation...one needs a graduate degree to really have any depth.

For my money, to call oneself a meteorologist, you should should have at least this background.

All NWS forecasters meet these requirements. Only about half of the TV weathercasters in this country do. So to be honest, not all TV weather folks are meteorologists, but are weather communicators. Many military forecasters do not have this training (they go through less rigorous training, but their officers have real degrees).

New KUOW Facebook Feedback Site:

One good thing that came out of my troubles with KUOW is that a group of articulate, motivated listeners have come together with the hope of improving their public radio station. They created a Facebook page where all listeners could provide their ideas for improving KUOW, without fear that their comments would be removed by KUOW management (which has happened I understand). Called KUOW Listeners Speak Out, this site is available at:

http://www.facebook.com/pages/KUOW-Listeners-Speak-Out/206337796069124

Ten years ago, unhappy listeners would have been limited to writing letters, sending emails, and making a call. Now they can interact and build their own community with the goal of giving the listeners a strong and powerful voice on how public radio is run.

Why we suffer with low clouds

| comments

Take a look at the visible satellite picture today and something strikes you: most of the eastern Pacific is covered with clouds! The majority of these are shallow stratus or stratocumulus clouds found within the lower few thousand feet.

During this time of the year the atmospheric structure of the eastern Pacific is often characterized by a relatively shallow moist layer, with dry air overhead. Want to see a sample of this? Here is the sounding of temperature, wind, and dewpoint at Forks on the WA coast. Such soundings are produced by launching radiosondes--instrumented weather balloons. Remember when the temperature (red line) and the dewpoint (blue line) are close together, the air is saturated (100% relative humidity). The height is in pressure (1000 mb is near sea level, 900 mb is around 3000 ft). Temperature is in centigrade.You see that the low-level air is moist and saturated in the lower few thousand feet and very dry aloft. In fact, capping the moist layer there is a very stable layer--an inversion where temperature increases with height. Want to know why we are so persistently cloudy during late spring and early summer?---blame that moist layer and inversion!

Now why do we get this infernal atmospheric structure? Ironically, it is due to high pressure over the eastern Pacific this time of the year! Here is the pressure pattern this morning (Wednesday) at 5 AM. You see the big high? That is the culprit. High pressure areas produce sinking motion, particularly on their eastern sides. The sinking decreases towards the surface (since air can't do through it). Sinking produces warming. Thus, there is more warming aloft. That produces a an inversion or stable layer! Think of it this way....warm, less dense air, with cold denser air below does not like to mix, since the cold air is heavier. With a stable atmosphere there is not a lot of mixing, so the lowest portion of the atmosphere in contact with the ocean get moister and moister...and you can imagine what that produces....low clouds.

So high pressure gives us June gloom, Juneuary, or tomato hell...whatever your favorite terms for this dismal situation is. But you can escape it! The marine air is shallow and doesn't get across the Cascades...so head over the pass and you can enjoy sun and warmth...that is what I did last week when I went mountain-biking near Thorp with a friend.

But take a look at that satellite image again..you see the really clear area over the northern CA coast? What causes that? Any meteorologist worth his/her salt knows---offshore flow. If you look at the surface map above (which also has low level winds, click to make big) you will note the pressure lines (isobars) and winds suggest an offshore component of the wind across northern CA...those offshore winds are driving warm, dry continental air over the ocean, producing the clearing.

It looks like we are going into a period of absolutely boring weather. A lot of days with low clouds in the morning, some sunbreaks, temperatures near or bit below normal in general. But no tornadoes, windstorms, wildfires, flooding, or anything that will distract us from complaining about the low clouds. And you may have to start watering your garden.

Other news:

I will try another videopodcast Friday morning to replace my KUOW segment.

I left a detailed commentary about the KUOW situation at:
http://www.facebook.com/pages/Put-Cliff-Mass-back-on-KUOW/149155005153152


And PLEASE, will someone run for the district one Seattle School Board position against Peter Maier! Many of us really are hoping that we can turn the Seattle school district around, but we have to replace a few of the poor members that allowed things to get so bad.

Onshore Push

| comments

Update 7 AM Tuesday...the push was fairly strong last night---and still quite breezy this morning. The satellite picture below shows low clouds pushing to the crest of the Cascades. Want sun today? Simply go over the passes. A few miles more and you will be in bright sun. But remember that places like Ellensberg will get hammered by strong NW winds today...and golf at Suncadia will be, lets say, a challenge. (and see the new video link at the end of this blog)


My wind chimes are ringing right now and the trees are starting to sway as the wind increases. Such behavior after a warm day means only one thing...an onshore push has started.

Temperatures rose into the low 70s over much of the western lowlands today, but as we enjoyed the warmth an upper level disturbance has been approaching and the difference in pressure between the coast and interior has been rising. These changes are producing an onshore surge of marine air that will bring a substantial cooling tomorrow (by at least 10F) and the return of low clouds in the morning.

Meteorologists follow the pressure differences very carefully during such events. North Bend, Oregon minus Sea-Tac is one that is popular. I prefer Hoquiam minus Seattle. As shown below, this pressure different grew from near zero to around 2.6 mb today....enough for a modest push. For a strong one you look for 3.5 to 4 mb. The times below are in GMT (18 is 10 AM, 00 is 5 PM)


Here is the predicted upper level chart for 2 AM this morning. You can see the trough--centered over Vancouver Island-- moving towards us. Onshore pushes with northwesterly flow tend to be be on the weak side.


Perhaps the best way to see a push in progress is by looking at the wind and temperatures from the Seattle Sand Point profiler (below). Time is on the x-axis and height (in meters) on the y axis. If you can read the blue wind vectors, you can see that the winds are now from the southwest in the lowest 1000 meters (roughly 3000 ft) and increasing....a good sign of an onshore push.


And the low clouds offshore have thickened and started to push in! (see satellite picture below)

So get your sweater out for tomorrow...highs will be in the lower 60s, clouds will dominate, and there even could be some light sprinkles. By the afternoon there could be some cloud breaks and maybe a bit of sun.

Onshore pushes are the main forecast problems during Northwest summers---some call it our version of air conditioning.

Finally, a key point is that we are in a very different pattern from the last few weeks--it may not be hot, but endless days of clouds and rain are NOT in the forecast.

KUOW: Several listeners delivered the petition with nearly 5000 signatories to KUOW today and talked with their program manager Jeff Hansen. KCPQ-TV (Channel 13) covered it....and should be on at 10 PM. Here is the segment on KCPQ:

http://www.q13fox.com/videobeta/?watchId=38b0cbf5-7207-405f-8369-01a9125fab7b


KCPQ also gave me some time to talk about what I would have said on KUOW if I had been allowed. I am working on a detailed blog about my interactions with KUOW and particularly their reactions during the past few weeks. I really think KUOW has serious issues and I will try to analyze them in this work.

Record Breaking Storm Hits California

| comments

While we are enjoying the most spectacular day since late last summer, California has been hit by a very unusual storm that has brought heavy rain to coastal and central California.

The satellite picture is simply stunning:

A deep low is circling off the Bay area, with a very strong front extending over the coastal areas. This kind of system would be remarkable in mid-winter, but in mid June it is highly anomalous. In contrast, much of the northwest is cloud-free, with high temperatures in the mid to upper 70s. I am even thinking of buying some tomato plants!

Take a look at the surface analysis Saturday morning (below). The NWS is analyzing this cyclone to have a 994 mb low center . An objective analysis of the difference between this pressure field and normal indicates that it is an extremely unusual anomaly.


Take a look at the radar image from the Monterey NWS radar for Saturday morning at 7:03 AM:

The yellows are pouring, heavy rain. You don't want to know about the reds. This would be a major rain event for us during the winter--for cloud-adverse Californians this is extreme weather.

Here are the rainfall totals over the past 24 h (ending 5 PM from the NWS) around the bay area:

Lots of 1-2 inch totals, with some coastal locations getting 3-4 inches. Many stations have received daily record amounts. Here are a few:

California has had some drought worries the past few years. Not a worry this year. This is the first time in years that the NWS drought maps have shown no issue anywhere in California. They have enough problems...at least water won't be one of them this year.

La Nina is rapidly weakening and the NWS is now forecasting a normal summer for most of Washington. The skill of these predictions are not great, but ....


KUOW Information:

If you are interesting in supporting a petition to reinstate my weather segment here is the petition site:
http://www.petitionbuzz.com/petitions/cliffmassonkuow
Facebook web site:
http://www.facebook.com/pages/Put-Cliff-Mass-back-on-KUOW/149155005153152


A few people have asked whether I will be at the rally on Monday afternoon at KUOW (see facebook site). I won't because the conversation should be between concerned KUOW listeners and station management.
 
Support : Creating Website | Johny Template | Mas Template
Copyright © 2011. The Weather - All Rights Reserved
Template Created by Creating Website Published by Mas Template
Proudly powered by Blogger