Feeling a bit tropical outside?

| comments

Seems a bit humid?   More like the East Coast in summer than our normally low relative humidity?

The dew points...a good measure of the moisture in the air...are quite high today, reaching into the lower to mid 60s right now (around 2 PM Saturday).

Here are the current dew points at some local stations--no lack of 60s!


And with temperature in the low 70s, the relative humidities are quite high, with plenty of locations above 80%:


No wondering I am sweating so much while I am working in my garden today!

Typical dew points around here in the spring and early summer are more typically in the mid 40s.   Lets illustrate with Olympia, where the dew point is now 63F. This plot shows the dew points for the past 12 weeks.  Today is highest, with one time in early June getting to 62.

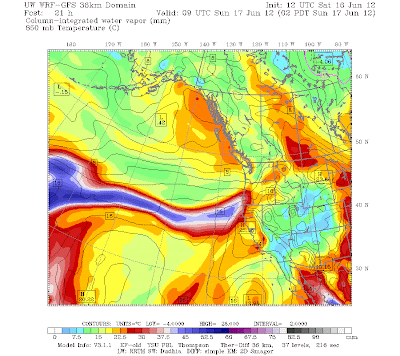
 To be so warm, with lots of clouds, and such high humidity means only one thing....tropical or subtropical air has reached us.  To illustrate this, here is the vertically integrated water vapor in the atmosphere forecast to occur at 2 PM today (Saturday):

 You can see the "atmospheric river" of moisture approaching us from the southwest.  Tomato plants love this kind of weather.

Don't like warmth and high humidities?   No worry.  This tongue of warmth and moisture is only transitory and will head south of us tonight (map at 5 AM below):


Time to break the bad news to my tomato plants.

Weather-X

| comments

There has been a lot of press coverage of late about the successful commercial space venture Space-X.   This private sector effort was able to build a launch vehicle (Falcon-9) and a spacecraft (Dragon) that not only worked flawlessly, but made a delivery to the international space station.  With NASA out of the manned space business for a while with the end of the Space Shuttle program, this feisty young company has taken on a role previously held only by a U.S. government agency, and they did it far faster and cheaper than a Federal entity could ever do.   To its credit, NASA has been supportive of Space-X's activities.

Falcon-9


Dragon

So now let's consider weather prediction.  A portion of U.S. numerical weather prediction has been done outside of the National Weather Service/NOAA and the U.S Navy (Fleet Numerical):  in the private sector and academic institutions (like the UW!).  However, the core global prediction infrastructure for the U.S. has really been a NWS function and most of the non-governmental efforts are dependent on NWS global grids, data assimilation, and other products.

Unfortunately, the current situation is not good.  The National Weather Service prediction efforts are crippled by inadequate computer infrastructure, lack of funds for research and development, an awkward and ineffective research lab structure out of control of NWS leaders, and government personnel rules that don't allow the NWS to replace ineffective research and development staff.  Lately there has been talk of furloughs for NWS personnel and a number of the NWS leadership are leaving.  The NWS has fallen seriously behind its competitors (e.g., the European Center for Medium Range Weather Forecasting, UKMET office, Canadian Meteorological Center) even though the U.S. has a huge advantage in intellectual capital (U.S. universities and the National Center for Atmospheric Research are world leaders in field, as are several U.S. government research labs--e.g, NRL Monterey).

So we have a U.S. government entity that has lost leadership in a key technological field of huge importance for the nation.  It no longer has the resources to be state-of-the-art and is hemmed in by ponderous governmental regulations.   Sounds quite a bit like NASA's situation, doesn't it?   And might the solution be the same?    Could a private company develop the capability for state of the art global prediction, high resolution regional prediction, and the ability to move into the probabilistic prediction we know represents the future?  Is it time for Weather-X?

The clear answer ... you bet.

Let me be honest, I am really surprised that a private sector firm hasn't taken on this challenge already, considering the obvious potential to create a forecast entity that could produce a product that would be in considerable demand.  For example, U.S. companies are spending millions of dollars to get the European Center (ECMWF) forecast model output---and it is possible to do far better than the ECMWF. 

To create this new firm one would need large computer resources (.5 to 1 petaflops would be a good place to start).   That would cost 10-15 million dollars to buy from scratch, but many companies (e.g., Microsoft, Google, Boeing, Amazon, IBM, major defense contractors, and more) have it already.

The new firm would need computer models, but those are already freely available, and research folks like myself could easily be bribed to help with some research grants (trust me on this!).  In fact, the research community would be lining up at the door to help if some $ was available.


The most difficult aspect is the data assimilation part... securing all the satellite and observational assets needed to initialize the forecasts---but many of those are in the public domain and I suspect that some deals could be made with NASA, NOAA, and the European Space Agency.  And there are some potentially very useful data sets that the NWS can't afford today that would be a substantial value (e.g., weather data from commuter planes).

Yes, it would probably take 5-25 million dollars to get started on this, but consider that the folks at Space-X invested 100 million dollars for a venture that was far more speculative.   Local investors are willing to spend as much or more ON A BASKETBALL TEAM. 

There is no doubt this idea would work. The best weather forecasts in the world would be a valuable commodity for many industries that would be ready to pay (e.g., renewable energy, agriculture, power generation and distribution, shipping...the list is endless).   Want to make your search engine attractive?   Have the best forecasts available on it!

Some of you might argue that my colleagues in the NWS might not be pleased about such an upstart.  But if NASA can happily agree to work with a private sector firm to take on some of its work, why should the NWS be any different?  I suspect the private sector could fulfill this function more effectively and at less cost.  And the benefit to the nation of vastly improved weather prediction guidance could be enormous.

As noted above, there are several companies that already have the computer and IT infrastructure in place to take this on (such as Microsoft, Google, Apple, and Amazon).  Several of them are found here in the Northwest.  All that is missing is the vision to see the opportunity and seize it.


Ocean Full of Clouds

| comments

Sometimes during springtime one looks at the visible satellite imagery over the eastern Pacific and can't help but be impressed that nearly the entire ocean is covered by low clouds.  This morning provides a prime example:

 Pretty amazing.   You have to feel sorry for those poor mariners crossing the ocean with day and day of low clouds (mainly stratocumulus).  Even central and southern California coastal residents are in the murk and you can see the low clouds spreading to the crest of the Oregon and Washington Cascades.  Folks, this is what June gloom looks like from space.

You see the checkerboard pattern over the ocean?  Those are ship tracks....the result of the effluent from fossil fuel burning ships.  The particles from combustion result in more condensation nuclei and more water droplets.  More droplets results in more of the sun's rays being reflected back to space.  Here is a close-up view. You can see why the U.S. Navy likes nuclear ships...no ship tracks!


To illustrate the murk at ground level, here are the latest webcams at Cannon Beach Oregon:


and at Del Mar near San Diego.


Kind of makes a Northwestener feel better...we have have company.

The ironic thing about this extensive shield of low clouds is that it is the result of HIGH PRESSURE.
Don't believe me?   Well, here is the proof...the 6-h forecast for sea level pressure over the eastern Pacific.  A huge high pressure area dominating the eastern Pacific, while low pressure is found over the southwest U.S..  Between the two there is a large difference in pressure near the Oregon/CA border...which produces very strong winds there (described in a previous blog).


High pressure produces sinking air and sinking causes warming. The sinking decreases as the air approaches the surface.  So with strong warming aloft and cool water near the surface we end up with an inversion (warming with height) in the lower atmosphere.   So we have a veneer of cool, moist air (with lots of low clouds) near the surface and dry warm air aloft.  Here is the latest sounding from Quillayute on the Washington coast (red is temperature, blue is dewpoint)... this structure is really obvious.
The vertical axis is pressure.  850 hPa is roughly 5000 ft.  Where the temperature and dewpoint are on top of each other we have a saturated (cloud-full) environment.  Here is a similar figure for San Diego (no color coding of lines).  Same structure.


So the secret of getting away from the low clouds is either to go above roughly 3-5 thousand feet (good if you own a helicopter or can hike up a local peak) or cross the Cascades.  Sorry.

Troubles at the National Weather Service

| comments

The last few weeks have brought hard times to the National Weather Service. 

A number of media outlets have reported on apparent spending irregularities in which approximately 30 million dollars was taken from certain development budgets to support NWS offices throughout the U.S., a procedure requiring congressional approval that was not secured.

When this story become public (there were dozens of articles in newspapers around the country, examples:  NY Times, WA Post), NWS head Jack Hayes decided it was time to retire (more on Jack Hayes, later).

The National Weather Service has a shortfall of roughly 26 million dollars THIS fiscal year and unless Congress comes up with more funding the Weather Service is going to furlough each of their 4800 employees for 13 days (story here). We are talking about thunderstorm, wildfire, and hurricane season. 

Meanwhile, an inspector general report on May 18 alleged the National Oceanic and Atmospheric Administration paid $43.8 million in award fees or contract extensions without proper justification, mainly for contracts dealing with weather satellites.

And if that is not bad enough, a number of the high level leadership of the Weather Service will be retiring or leaving for greener pastures.   AND the Secretary of Commerce, whose department they are a part of, has been involved in a headline-grabbing series of auto accidents in California.

These folks are in a world of hurt.

 I would like to make a few comments on the above.   I have known Jack Hayes for a number of years--first as head of the AF Weather Agency, head of the NWS Office of Science and Technology, and for the last five years the leader of the National Weather Service.   He is a highly committed and honorable individual.  A few years ago, when there was a great deal of uncertainty about the coastal radar, he called me...he gave
Dr. Jack Hayes
 his word the radar would go in and quickly.  No more opposition or delays, as had gone on under his predecessors.   He kept his word.   Remember my blog a few months ago about state of the numerical weather prediction in the U.S.?   Guess, who called a few days later to talk it over and to assure me of his commitment to change things....Jack Hayes.    I could give you a dozen more examples like this.  He was concerned, engaged and a straight shooter--as well as a nice guy.

The National Weather Service has been underfunded for years.  According to the general counsel of the NWS employees organization, NOAA higher-ups knew about the structural deficit for a long time as well as the standard practice of covering employee salary increases from other pots of money.

The NWS has never had enough funds for state-of-the-art computers or to support outside research that could advance weather prediction.  Desperate for funds, they recently proposed removing IT support from its offices by providing remote support (you can imagine how well that would work!).  It appears that Jack Hayes was doing what he could to keep the wheels on the bus of a critical agency.  And there is no suggestion of funds disappearing or being used for personal needs.

NOAA leadership seems far more interested in climate and ocean issues than weather prediction, and this had been true for a while (yes, even during the Bush administration).  As an example, there was a push to form a National Climate Service--a parallel organization to the NWS.  Congress pulled the plug on this late last year.

My hope is that now that the underfunding of the NWS is out in the open, congressional leadership will take steps to ensure that this agency, with critical responsibilities for life and property, is funded at an appropriate level.  They would be well advised to taking a hard look at whether NOAA belongs in Commerce, and if the current structure of weather related research and operations spread over the NWS and NOAA makes sense.


Seasonal Precipitation Surprises

| comments

You ask any resident of Washington, Oregon, or California:   when is the wettest time of the year?   Without hesitation they will answer:  during the winter.  The Goretex season.

But ask a resident of Montana, particularly the eastern two-thirds of the state, and they would give you a different answer:  May and June!

Or talk to someone from southern Arizona or New Mexico and they will give you an even different answer:  July and August.

Why are there such differences?

First, lets explore the seasonal variation of precipitation a bit.

Here is a fascinating image that give the percentage of the annual rainfall falling from October through March...essentially winter.
Much of the West Coast gets 80% or more of their annual precipitation during this winter period, with the Bay area getting more than 90%.  Winter wet and thus summer dry.  This is what we term a Mediterranean climate.  Residents of the wet NW rarely think they have much in common with the Mediterranean climes, but it is true.  Rick Steves needs to know about this--why send so many folks to Italy and southern France when we have the same climate right here at home!

But look inland: the percentage of annual precipitation during winter drops continuously, and by the time you get to the eastern side of the Rockies much of that region only gets 20-30% of their precipitation during winter.  Winter is the dry time of the year there!
These folks in live in a weird climate!

Now here is the percentage of annual precipitation during Spring (April through June).
Mamma Mia!  Eastern Montana, Wyoming, and the Dakotas get roughly HALF of their precipitation during these three months...this is their wet season.  On the other hand, this is a time of EXTREME aridity in southern Arizona and far southwest CA.   A good time to enjoy some warmth in Tucson with little worry about a cloudburst.
And finally there is midsummer (July and August).   The West Coast gets LESS THAN TEN PERCENT of its annual precipitation then, while southern Arizona and much of New Mexico get roughly half of their annual precipitation.   This is the time of the Southwest Monsoon, when moisture streams up the Gulf of California into the Desert Southwest.  Lots of lightning and thunderstorms.

So how do we explain these differences in annual precipitation?

During the winter the jet stream..the current of westerly (from the west) winds in the midlatitudes, is strong, bringing wet Pacific systems into the West Coast.  But folks to the west of the Rockies are shielded by the mountains...they are on the downslope, rainshadow side of the barrier.

During the spring the jet stream weakens and fewer and weaker storms approach the West Coast.  We start to dry out (yes, there are still lots of clouds and sprinkles).  But the weaker jet stream is associated with increases undulations in the flow, including more cut-off lows and troughs the bring southerly flow, less rainshadowing, and more rain to Montana and vicinity.  Here is an example of such flow (this shows the flow at 500hPa, roughly 18,000 ft, the winds are parallel to the lines).


In midsummer, the jet stream and weather disturbances from off the Pacific are history, but monsoon moisture coming out of Mexico produces thunderstorms and convective showers in Arizona, New Mexico, and parts of Colorado.

Now over the eastern U.S. the situation is even stranger...they get nearly the same amount of precipitation EVERY MONTH OF THE YEAR.  Cyclones and fronts during winter, thunderstorms during the summer.

Think about it: We get our rain over during the winter, when days are short.  Our summers are dry and mild, when days are long.  We are blessed.


Depressing But True

| comments

 The May climatological numbers are in and the contiguous U.S. has had its second warmest may on record.  But guess what region did not share in the balmy conditions?

You guessed it...the Pacific Northwest.

Here is the difference of May temperatures from normal (red above normal and blue below normal).  The cold almost perfectly follows the state boundaries of our region.  Only the Cascade western foothills were above normal--perhaps due to downslope warming.


What about January through May?  A similar picture with Oregon, Washington and northwest CA cooler than normal.   You will notice that warmest temperatures were shifted back to the Great Plains for Jan-May.

Precipitation?  For May, the Northwest was near normal, but for Jan-May above normal.
June so far has been cooler and wetter than normal, while just to our southwest very warm and dry conditions are occurring.


That is why we are shivering and our snowpack is way above normal while southern Utah has already started their wildfire season (see image below).


Utah Wildfire
The forecast?   The next week looks substantially drier, with only a few light showers, and temperatures should be near normal or a bit on the cool side....but clearly not as bad as the last week.  The best day of the weekend will be Sunday.   For more weekend forecast information, check my segment on KPLU (www.kplu.org), which should be online after 10 AM....or listen to my 9 AM discussion with Keith Seinfeld over the radio or online live.


Coastal Clouds

| comments

Yesterday I told people who wanted to view the transit of Venus along the coast to go as close to the water as possible...why?

There is often a major difference between the amount of clouds offshore or right on the coast and just a short distance inland, with clouds increasing inland--so being right on the coast really increased the chances of seeing the transit of Venus yesterday.

Here is an example of the effect.  First, a visible satellite picture from the GOES satellite at 3 PM  yesterday (about when the transit started!).  There was some clouds and convective showers offshore, but look what happens as the air crosses the coast...you can see lines of small cumulus developing, aligned in cloud "streets" parallel to the winds.  You can also view the convergence zone over Puget Sound and the enhanced clear zones to the north and south...many of you wisely headed there.


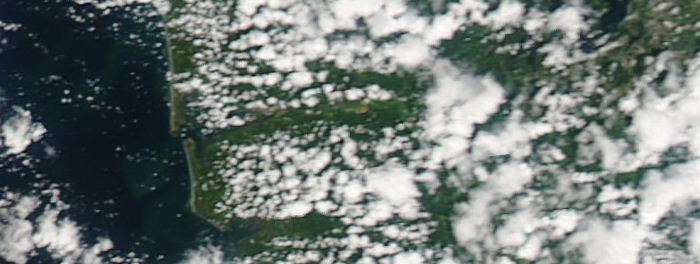
We can get a better view of the development of coastal clouds from another satellite: the polar-orbiting MODIS system.  Here are two pictures from it, with horizontal resolutions of 250 meters.  The first image is along and east of the central WA coat and the second southern Vancouver Is.  You can really see the effect in this images...relatively cloud free offshore and on the immediate coas,t with clouds developing inland.  You notice that some of the clouds even get bigger inland.


High-resolution weather forecasting models, like the UW WRF model run at 1.33 km grid spacing, can produce this observed cloud distribution.  Here is a sample from yesterday
for a forecast valid at 3 PM.  Not bad...and it also got the convergence zone clouds and the clear zones to the north and south.  


So why do clouds form just inland along the coast, particularly during the day (this phenomenon is far less prevalent at night).

This time of the year the sun is quite strong and is able to heat up the land substantially when a solid overcast is not overhead.  The water offshore is cool (roughly 50F).  When cool air moves over the warm land, we have a large change of temperature with height.   Such large vertical temperature changes can cause the air to convect, producing upward thermals and cumulus clouds.  This is quite similar to what happens in your saucepan when you turn on the burner...a large change in temperature with height causes your cereal to convect.

This convection takes a time to develop, so there it is a mile or so inland before clouds start forming in a significant way.


The development of coastal clouds is also helped along by what is called coastal frictional convergence.  This is the kind of terminology that will impress your friends and fascinate folks at cocktail parties.  The ocean surface is aerodynamically relatively smooth (little friction) and thus winds over water are strong.   Over land the surface is far rougher and that slows down the winds.

So if air is moving inland (eastward)....fast moving air from the ocean meets air that is moving more slowly over land.   Air get piled up and some of the air is forced to rise...this is the coastal convergence.   Rising air produces clouds.

Finally, in many parts of the Pacific  coast there is terrain just inland, terrain that causes air to rise...and yes....forming clouds.

So for a number of reasons, expect more clouds as one moves inland from the shore.  Another reason that hotels on the coast can charge more than their brethren  a few miles inland.


Last Venus Transit Update

| comments


If you are near Seattle, head to the two oval areas...downstream of the mountains of Vancouver Island or the Olympics.   Cloud free conditions.    Seattle is in a convergence zone and will NOT be a good location to view the transit.  The coast will be decent...off and on clouds...but there will be gaps. (I have folks there right now reporting decent viewing)  Same with the Willamette Valley.  If you are driving south on I5 you will hit the clearing from Tacoma to roughly Olympia.

Venus Transit Weather Update

| comments

The clouds are thinning over the Northwest  and the biggest improvement is along the coast.  Here is the latest visible image at 11:40 AM:


There is an enhanced area of showers going into the Washington coast, but that will be through by 3 PM.  I am encouraged that the showers are suppressed offshore.  If you are on the coast...go ALL the way to the coast...to the waterline...should be less clouds there.  Any there will be clouds and sun..so you can see the transit in the gaps. Eastern Oregon seems to be opening up now as well.

Weak convergence is keeping the central Sound cloudy with some showers...these should lessen during the afternoon but still should be a problem.  The latest 4/3 km WRF run also suggest that the Sequim/N. Whidbey island/San Juan area should be open, and perhaps the far south Sound (e.g., Olympia).  In fact, the area south of Tacoma, might be a  good bet if you want someplace close to SEA...it is in the lee of the Olympics.


Good luck...this is an extraordinarily rare astronomical event.

Venus Transit Update

| comments

8 AM Update: The Oregon coast has opened up into scattered clouds. Here is the satellite image:

The inland band will slowly move out.   

Further updates at 11 AM when all the model output is in.  The big question for all transit lovers....head to Sequim or the coast?


I am getting a bit more optimistic that many of us will see the transit...or be able to view it with a modest drive.   Each forecast run is clearing out more...particularly on the coast.  Here are the cloud fields from the UW WRF model for 5 PM tomorrow...the first shows liquid water cloud content, the other, the simulated satellite view.  The coast is generally clear...and even Sequim looks like a possibility.  There appears to be a convergence zone over the central Sound...not good. 


So if you want to have a good chance of viewing the transit--head to the coast.  If you can't go that far, head to Sequim, north Whidbey Island, or down to Olympia.

No guarantees....but looking better.   More information tomorrow AM....cliff

Where to See the Transit of Venus?

| comments

Update Monday evening:  Sequim and vicinity might be a possibility.

Tomorrow, from around 3:09 PM to sunset, Venus will move in front of the sun---the famous transit of Venus.   This is an extraordinarily rare event that will not occur again for over a century (December 11, 2117).

The problem is that a weather system will pass through the region tomorrow morning and afternoon...but there appears to be a chance that some NW residents will see it.

Bottom line:  for Puget Sound residents, head for the southern Washington coast or Oregon coast for maximum chances of viewing.  Westport might be the closest location that is viable for Seattle residents.  Or head south to Longview/Portland.

I don't have much time right now...but here are some of the model graphics, indicating cloud cover.  First, cloud forecasts for 2, 5, and 8 PM.


 Portland and northwest Oregon may luck out.  There is some uncertainty with these forecasts...lets see what tonight's runs show.

Here is the official National Weather Service sky cover percentages for 5 PM and 8 PM:


Coal Trains: Bad for the Northwest Environment

| comments

There has been a lot of discussion about  to greatly increase the number of coal trains passing through Washington State, trains that would move coal mined in Wyoming and Montana to ports where it would be loaded on to ships destined for Asia.   A number of local groups are opposing this idea and recently the Seattle City Council voted for a motion against the trains.


Folks,  coal trains and coal export to Asia are poor ideas and bad for the environment on a number of levels.  

Those who have read this blog know I am no global warming radical...and on a number of occasions I have spoken against those exaggerating the local threat of increased greenhouse gases.  But anthropogenic (man-caused) global warming is a very serious issue and the earth will warm considerably during the next 50-100 years because of increasing CO2 and other greenhouse gases (e.g., methane). Coal is one of the worst fossil fuels, in terms of production of CO2 per unit heat produced, and it is dirty, resulting in lots of particles and toxic gases in the atmosphere.

So here we are in the U.S, driving our hybrid cars, expending large amounts of money on renewable energy sources, insulating our homes and business, and working in a dozen other ways to lessen our carbon footprint.   And at the same time we plan to mine tens or hundreds of millions of tons of coal a year and ship it to China?  This makes no sense.   And it costs energy--lots of energy--to ship the coal to our ports and then across the widest ocean in the world, and then to move it to where it is needed in Asia.

But is is far worse than that.  Each coal car is a huge source of coal dust--Burlington Northern estimates about 500 lb of coal dust is lost per car during the trip.   Thus, we also have a substantial local public health problem as local communities near rail lines are covered by a veil of particulates that can cause serious respiratory problems for those with asthma and other health issues.  In fact, some of us at the UW are sufficiently interested in this that we plan on measuring these dust levels over the summer as some of the coal trains lumber by.  And the diesel trains that  pull all these coal cars are THEMSELVES big pollution sources....diesel engines produce a toxic collection of substances that irritate the lungs and even cause cancer.

Want to see the coal dust blowing off a coal train? Click on this image to see a video of a coal train in British Columbia...you will see HUGE amounts of dust blowing off into a scenic river basin:


Even worse...once the coal gets to China they burn it, producing all sorts of particulates and gases that then moves across the Pacific to worsen regional air quality problems here in the Northwest.  In fact, Professor Dan Jaffe, of UW Bothell, has documented the substantial contribution of Asian pollution to our background pollution levels (see here for one story on this).

So coal trains will greatly contribute to increased global warming and will undermine the health of Northwest residents both from the coal dust blowing off trains and the air pollution that the coal will produce in Asia and which will blow back across the Pacific into our area.

And one more thing---more coal trains will lead to more traffic in many Northwest cities, since there are numerous train crossings on major local roads.


I know what some of your are thinking....if we don't supply the coal, the Chinese will just purchase it elsewhere--with the same impact on global warming and cross-Pacific pollution.  And we lose a big sale!

 I just don't buy it. China is choking is its own pollution, reducing the lifespan of its citizens.  They need encouragement to move away from dirty coal, and facilitating their dependence on this fuel so we can make some money is ethically unacceptable.  You can make good money selling drugs to the addicted, but is it the right thing to do?  Certainly not.  There is a lot of talk about "Clean Coal" in the coal industry, but it is all hype--coal is dirty and no one has developed a technology that can economically remove the CO2 or lessen the air pollution problems it produces.


 Here is the U.S., we are slowly weaning ourselves from coal, particularly as natural gas becomes so cheap and renewable energy is becoming more widespread.  I believe the world is making a major mistake in moving away from nuclear energy.   Nuclear power can be accessed in a safe, clean way and the dumb mistakes of previous installations should not prevent it from taking a valuable role in providing massive amounts of power during our transition to renewable sources.  Yes, radiation is a danger, but so are the proven health and greenhouse warming dangers of burning fossil fuels.  Here is a figure relating the death rates per unit energy for coal, oil, and nuclear, based on statistics found here:
I have looked at a number of sources, and the results are consistent:  nuclear, even with the mistakes made at some locations, is far safer than burning fossil fuels.

 
Support : Creating Website | Johny Template | Mas Template
Copyright © 2011. The Weather - All Rights Reserved
Template Created by Creating Website Published by Mas Template
Proudly powered by Blogger