Last Night's Squall Line

| comments

Last night, between roughly 12:00 and 1:00 AM (depending on where you were) an intense line of thunderstorms and strong winds moved across the Washington coast and swept across western Washington. Winds gusted to 60-70 mph along the coast and to 40-50 mph in places across the interior. A significant number of trees were toppled plus innumerable loss of branches, resulting in power outages affecting thousands of people. Thousands are still without power Tuesday evening. And there was quite a bit of lightning too.

The cause a line of thunderstorms associated with a strong cold front. Here is the radar image at around 12:30 AM (and a close in shot as well). The strongest rain associated with the line is indicated by red color (very, very heavy rain is associated with reds!)

There was a considerable change in virtually all weather parameters with this front. Here are the observations at the top of the atmospheric sciences building here at the UW (click to expand). The winds gusted to 40 mph (top line), the wind direction shifted abruptly to the south, temperature plunged by 6F, pressure spiked upwards (fifth line), and lots of precipitation fell. My dog was terrified.

Was this predicted? Not really. We knew a strong front with good rain was coming in, but did not foresee such an intense event. But with a coastal radar we probably would have seen it coming and been able to provide a few hours warning.

The number of tree losses was undoubtedly aided by the saturated soil. Wet soil has less adhesion to roots...less holding power...making it easier to wind to do its dirty work.

The weather should calm down a bit now, with the jet stream and most of the action going into California, for the next few days.

AND...today there was an F2 tornado at Aumsville, 10 miles NE of Salem, Oregon.

Videos of NW Rivers

| comments

Here in the Northwest we have something better than storm chasing....after big rainfall events, head to the rivers, and particularly major falls...if you can get there. Some amazing videos of local rivers.

Here is the South Fork of the Stillaguamish at Granite Falls
http://www.youtube.com/watch?v=QPs-Ggmk6JA

or Snoqualmie Fallshttp://www.youtube.com/watch?v=chqHvRMyYRM

A good summary of the NWS flood warnings is found at:

http://water.weather.gov/ahps2/forecasts.php?wfo=sew&view=1,1,1,1,1,1,1,1&toggles=10,7,8,2,9,15,6

Here is a graphic from it showing observed or potential flooding around the area:

A number of flooding river and some represent major or moderate flooding (Skokomish, Snohomish, Stillaguamish, Satsop, Skykomish). How is this done? The National Weather Service takes rainfall observations and atmospheric model forecasts and use them to drive hydrological models of the flow in local rivers. These simulations create plots of future streamflow in time called hydrographs. We run such as system at the UW as well--here is an example of the output for the north fork of the Stillaguamish near Arlington:

Rain Ending over Puget Sound

| comments

Just a brief note...as the precipitation band now pushes southward (however, the flooding is yet to come for many locations since it takes time for the precipitation to move down the rivers).

Here is the total rain at 11:30 AM. A band of over three inches across N. Seattle and over the eastern suburbs, and over 4 inches for the Kitsap. Much less to the north.
Nearly eleven inches at Quinault! 7.3 inches at Cushman Dam. 4.2 inches at Verlot Ranger Statoon. Darrington and Skykomish about 4.5 inches. The totals in the mountains are impressive, but don't equal those of the REALLY big events.

Amazing Totals

| comments

This event still has hours to go, but the totals so far have been amazing. Here is the latest 24-h totals ending 8 AM this morning for central Puget Sound from Rainwatch:
3-4 inches over the Kitsap and a band of 2.5-3 inches over N. Seattle and the eastern suburbs. In Snohomish County the rainfall declines rapidly. Less south of Tacoma. Here is the larger view..and keep in mind that you can't trust this over the Cascades, the coast and far to the south, since it is dependent on radar information. Huge totals over southern Vancouver Island (over 6 inches). In the Quinault Valley there has already been over 8 inches (by 4 AM). Mark Albright provided some more totals through 8 AM Sunday event totals (since 11 AM Saturday)

Seattle 2.67 Boeing Field 2.98 UW 3.09 Shoreline 2.24 Mountlake Terrace 2.12 Everett (Paine Field) 0.97
Arlington 0.62

Here are the totals from the CoCoRahs volunteer network for the 24-h period ending 7AM. Less than 1/2 inch over southern Whidbey Island and the adjacent mainland, while N. Seattle is getting 2-3 inches. Makes you believe in the rainshadow.

The heavy rain should continue throughout the morning and then decrease as as the band pushes south this afternoon. Where the amounts exceed two inches there is a real threat of slides/slope movements on steep slopes.

The temperatures have jumped into the 50s for much of the regions and strong southerly and southwesterly winds are over us. Look at the Seattle profiler temperatures and sustained winds over the past day (below) . Time runs from right to left (left is the most recent), the y-axis is height in meters. Temps (C) in red. Huge warming and look how strong the winds are above us. A solid triangle indicates 50 knots. A triangle and long line is 60 kts. 20-30 knot sustained winds right above us.

You can just feel Hawaii.

The Warm Front Cometh

| comments

The latest radar shows a complex pattern, moderate to heavy rain over Puget Sound country, drying out south of Olympia, and a clear rain shadow to the NE of the Olympics.

The warm front is now moving across central Puget Sound. Take a look at Tacoma (McChord AFB) during the past 12 hours...over a period of 3 hours the temperature jumped from just above 40F to 57F! Now that is a warm front, the kind we rarely see around here.
As shown in the surface chart at 10 PM, the warm front was positioned between Tacoma and Sea-Tac Airport, with the wettest conditions to its north. The warm front has pushed farther northward along the coast.


Here is the latest precipitation totals from the Rainwatch Web site. A few areas in the lowlands have gotten above 2 inches.


1.33 inches at Sea-Tac so far .95 inches at Boeing Field, .39 inches at Paine Field. This event is not over yet....

More Serious

| comments

One thing that meteorologists look at carefully is the trend in the model solutions for the same period...in the biz we call this dmodel dt (those who know calculus will understand the terminology). Anyway, the trend of the high resolution forecasts is for more rain from this event.

Here are the 48h precipitation totals ending 4 AM on Monday. You will notice some increases over the central Puget Sound (like Seattle) and over the central Washington Cascades. If this is right and 2-5 inches falls over the lowlands, there will certainly be some flooded roadways and perhaps some slides. Want to stay dry (or nearly dry)?..head for Port Townsend! South of town the forecasts are for roughly .10 inch of rain. You could play golf in that! At the same time south Seattle could be getting 20-30 times more! Just amazing. And there could be 100 times more on the windward side of the Olympics.


The National Weather Service is on top of this and their River Forecast Center is now predicting more rivers to flood...here is the latest flood forecast map:

Red indicates flooding forecast and orange is bank full. The Green Basin will be getting more precipitation, but not enough to cause problems for the dam. So this will be a serious event..the kind we get once every 1-2 years roughly. If you are in one of the typically flood prone locations it is time to take action to protect your possessions and people's safety. And it is never a good idea to drive through more than a few inches of water.

And as forecast by our models, snow has begun on the eastern slopes of the Cascades (here is an image on I90 at Rocky Canyon west of Ellensburg.

Pineapple Express Update

| comments


I don't want to overhype this event--it should not be one of the "great" flooding events--such as December 2007, January 2009, or November 2006, but it will probably bring enough precipitation to cause flooding on a number of local rivers and to cause localized urban flooding, particularly south of Seattle. The latest infrared satellite figures says a lot--a current of warm, moist air is headed our way.


Here is something I haven't shown before--the 48hr precipitation total, in this case ending 4 AM Monday. 5-10 inches on the windward slopes of the mountain in "favored" locations, with over an inch in the lowlands from Seattle south.


You will note the profound rain shadowing over western Washington--with less than a third of an inch NE of the Olympics. A substantial gradient of precipitation over Seattle! Seattle Public Utilities will undoubtedly be dealing with more incidents on the south side of the city.

How much uncertainty is there in this forecast? Much less than for the snow predictions of two weeks ago (thank goodness!), but the amounts could vary substantially from the above. For example, there are often waves on the fronts associated with such warm currents and such waves are very hard to predict--thus, there could be some modulation of the timing and distribution of the rain that the latest model runs do have have correctly. A coastal radar could have given us some short-term (0-9 hr) information about such waves, but that will have to wait until next year.

The National Weather Service River Forecast Center in Portland uses observed rainfall and model predictions to provide forecasts of levels of major NW rivers. The latest is shown below. Red indicates basins with predicted flooding, orange indicates basins where the rivers are running bank full.

The weather should be decent over the area until lunchtime, by which time light rain should have made it to Puget Sound land--a good period to rake those leaves from the street drains and clear out your gutters.

There is a lot more to talk about.

There should be snow tomorrow afternoon on the eastern Cascade slopes as the precipitation comes in and cold air holds for a few hours. Strong winds along the coast and over NW Washington on Sunday. And substantial avalanche danger Sunday and Monday. Cross Cascade travel later on Saturday and Sunday will not be great...and road closures for avalanche work is probably inevitable. And there is a real risk of freezing rain in the passes later on Saturday and early Sunday before everything turns to rain.

Atmospheric River on the Way

| comments

Friday Afternoon Visible Satellite Photo---you can see the Pineapple Express already forming!

We have had quite a bit of heavy shower activity over the lowlands as well as snow in the mountains, but a period of heavier rain, particularly in the mountains, is on tap for later this weekend.

The first part of Saturday will actually be quite decent, but the action starts later that day as an unusually strong and well formed warm front pushes north across the region (see graphic).

Behind the warm front there will be a shift to strong, warm ,moist southwesterly flow that is connected to the subtropics--known as an atmospheric river...or as we call it here, a pineapple express.

This figure shows the amount of moisture in the vertical for Sunday at 4 AM. You can clearly view the narrow plume of moisture associated with the atmospheric river.


This strong plume of moisture will intersect our regional mountains, dumping substantial amounts of precipitation, particularly over the Olympics and N. Cascades.
Here is the 24-h rainfall for the period ending 4 PM Saturday....when the plume of moisture is mainly south of Washington. For those living in Washington State, if you want to do something outside over the weekend...do it before 3 PM on Saturday!

And here is the next 24-h. Serious precipitation over the Olympics and N. Cascades, with some amounts reaching 5-10 inches. A clear flood threat.

At this point, this event is no record-breaker, but it will bring serious rain and much warmer temperatures. Rain will fall on all that nice fresh snow in the mountains, SERIOUSLY contributing to a significant avalanche threat later in the weekend. Backcountry travel should be avoided then.

Squall Line!

| comments

Taking a look at the radar this morning was sort of like listening to shark theme from JAWS---you knew something intense was about to happen and it was time to take cover. Take a look at the radar graphic from the Camano Island radar at 7:26 AM:

Wow . An intense line of convective cells....sometime known as a squall line... was moving towards us. Green indicate moderate rain and yellow is heavy rain. This line was accompanied by lightning, a shift in wind direction, a burst in wind speed, a drop in temperature, a rapid increase in humidity and a jump in pressure.

Many locations had gusts to 30- 40 mph and at Paine Field in Everett the winds gusted to 58 mph! Several thousand people lost their power as trees hit power lines. Seeing what was happening the National Weather Service put out a severe thunderstorm warning at 8:15 AM.

Here is what happened at the UW today (click on the image to expand)--look at just after 15 at the bottom (that is 7 AM our time). The graph shows changes in wind speed (top), wind direction (second row), then temperature, relative humidity, pressure and precipitation.

A number of locations got .25 to .35 inches of rain as this line passed. Considerable street flooding occurred here in Seattle. The satellite imagery showed the line approaching the coastline a few hours earlier.

The eastern Pacific is full of convective clouds (cumulonimbus) associated with an unstable atmosphere. This complex array of lines and convective areas are not well forecast by current computer models. When the radar is installed on the coast at least we will be able to see them coming.


Talking about convective lines, several of you sent me this cartoon today, which is amazingly appropriate!

Image courtesy of http://xkcd.com/831/

Here is the precipitation map for much of western Washington from the Rainwatch Web site. A swath of 1-1.5 inches was found over Puget Sound. But what has been really exceptional has been the rain stretching from the north Olympic Peninsula into the San Juans. Strong radar echos were locked over that region for hours and rainfall totals of 2-3 inches have occurred in some locations (the pink colors).Talking about rain... a LOT is coming starting Sunday, with the establishment of a significant pineapple express event. And a super warm front. More on that later.

Seattle Snow Report Card and Some Suggestions

| comments


The Seattle Times and others have been evaluating Seattle's snow response and in this blog I would like to provide an in-depth analysis from a meteorological perspective. And I would like to make some suggestions of some new ways of dealing with the problem.

There is, of course, a deeper question: can municipal governments, or any government for that matter, be expected to deal with rare disasters? The Feds did poorly with Katrina, Seattle had problems in Dec 2008, and I think all of us could put together a similar list for other major environmental events.

However, I do believe that we can do much better with a little planning and creativity.

Background: Snow in Seattle is a big problem for many reasons. It is a rare event so the population and the various municipal agencies are inexperienced with it. We have hills so a skid can get real serious quickly. Our ground starts out warm and the first snow inevitably turns to slush before it is frozen solid by the usual post-snow "arctic blast." It is a difficult forecast problem because all the elements have to come together in just the right way for serious snow to occur (see my book for explanations of the last two elements). Because of the relative rarity, municipalities don't want to invest the considerable sums required to purchase enough equipment and supplies to clear the city quickly.

This is a very difficult problem and one that takes very smart moves and high-tech to do the essential job effectively and for modest cost.

Report Card:

The City

Mayor McGinn wisely didn't give the city any grades, but admitted that the snow got ahead of them. An intelligent answer. Personally, I give them a "B." First, they were committed to dealing with it and invested in additional equipment and substantial supplies of salt and other deicers. They put together a reasonable plan of using their limited equipment to clear the key arteries of the city (the only thing to d0). They put down large amount of brine solution the day before the big event. I know--I went to the airport the night before and was impressed: spray trucks were seemingly everywhere and the lines of deicer were on all the major roads I traveled on. These folks were working hard. As we shall talk about later, the brine solution was not enough and some of the problems (WSDOT's issues on I5, Metro's bus antics) were not of their own making. Finally, they are working hard to learn from what happened on Nov 22 and to do better next time.

WSDOT
They was the most perplexing thing about this event. WSDOT are masters at keeping roads open during poor conditions and they proved that during December 2008. But on Nov 22, something went wrong. First, they weren't able to keep I5 deiced. Secondly, they failed to open the northbound express lanes of I5, greatly contributing to northbound gridlock in the city.

METRO
They get decidedly mixed reviews. On one hand they acted very proactively before the storm---prior to a single flake they went to snow routes and chained up their buses. A gutsy call and it turns out to be the right one. But then they made some serious errors. First, when things got bad that afternoon, Metro should have pulled all their articulated buses off their routes--they didn't and many got stuck. A Metro bus was a major contributor to the southbound I5 mess. Second, they have to pull their buses off the steep routes where the danger was great. Too many buses remained on unsafe routes. This video shows you the results--thankfully no one was seriously injured. But that bus should not have been on that hill.


http://www.youtube.com/watch?v=rhZCyQ3emQg

But what really was maddening about the METRO folks is their decision to shut off the bustracker software EXACTLY WHEN WE NEEDED IT!! They have a lame excuse about the bustracker locations having errors when the bus go off the regular routes, but this make little sense. For most of the snow routes useful information IS provided. And they certainly could modify the bustracker website to provide what information IS there...when the buses pass certain locations. The truth is that METRO has been very slow in going to a GPS tracking system and have never given sufficient emphasis to giving its patrons good information about where the buses are located. They could be doing much better even with their current old-fashioned location system.

The Forecasters

You don't expect me to be critical of my own profession, do you? The National Weather Service did about as well as the technology allows--a forecast that was good enough to provide warning of potential trouble. The day before they were going 1-3 inches, mainly in the afternoon as a coastal low moved south of the Olympics. Basically, they closely followed their main high-resolution model (the NAM, WRF-NMM). If you read their forecast carefully, they were only going for some flurries or light stuff in the morning, but it turned out to be considerably more (1-2 inches in places). The coastal low was more intense that expected by their model and they had to up the forecast snow amounts during the day. The NWS was correct about cold air coming in later that day. I have to admit, my forecast was not as good regarding snow the night before. I depend heavily on the UW high resolution system, which usually is superior to the NWS NAM model for a number of technical reasons I won't go into here. But this situation was unusual and the NAM was better that morning (I will have a future blog telling why and steps we are taking to fix it). Essentially, the UW system took the coastal low further south and the snow shield only extended to south Seattle. The UW system recovered Monday morning with a very good forecast--in plenty of time to deal with the afternoon threat.
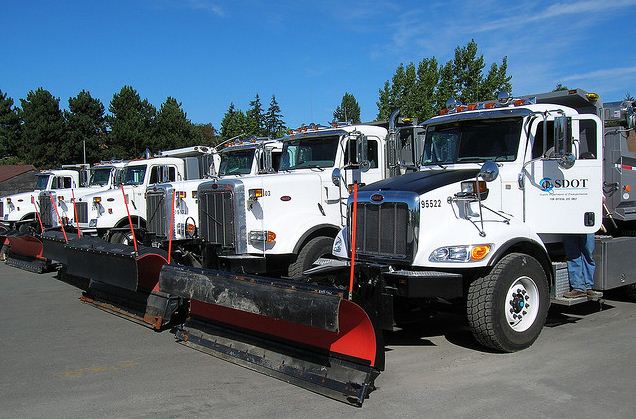
Play by Play Analysis

On Monday morning the temperatures were near freezing as the first pulse of snow moved in. Since it had not been that cold and this was early in the season (remember it was 74F a few weeks before!), the ground and road surfaces in contact with it were relatively warm. Even the elevated structures (e.g., the Alaskan Way viaduct) hadn't cooled below freezing. So when the snow started, particularly with generous amounts of deicer SDOT had spread around, the roads were fine. The morning commute had very little problems. People got into work and school. I even biked in with no hassles on the Burke Gilman Trail.

So far so good.

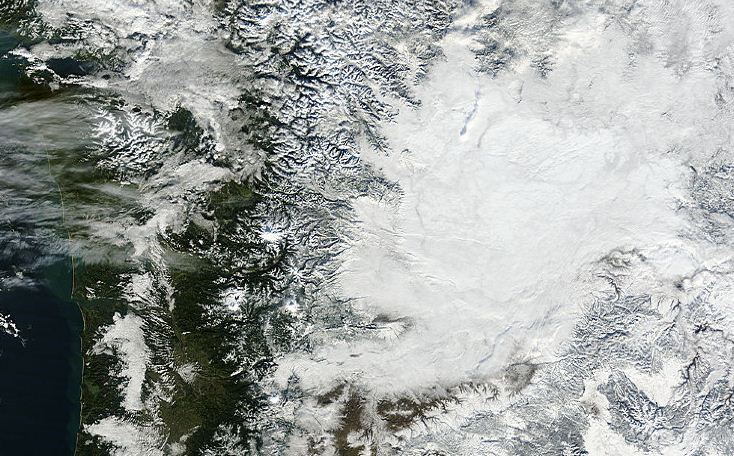
But then the problems began. The low center along the north coast deepened more rapidly then expected and moved across the southern flanks of the Olympics (see satellite picture below)


As the low moved south, it produced moderate, mild southwesterly flow that moved northward to meet northerly flow pushing south down the Sound (the northerly flow was accelerating toward the lowering pressure over the south Sound). The converging air streams resulted upward motion and bands of snow. But at the same time the northerly flow brought colder and colder air over Seattle starting around 3-4 PM.

Here are the temperature and wind plots from the top of my building at the UW that day. Temps were between 28 and 30F until just after 3 PM and then temperatures started to drop quickly. At the same time the winds started to become much stronger and gusty (see figure).Strong winds are important because they provide much more effective removal of heat from the surface. It is like a fan blowing cold air over the ground...much more effective for cooling.

And now it all came together. The deicer put on earlier was increasingly diluted by the larger volumes of snow falling into it until it became of marginal value. The air temperatures were rapidly dropping and the strong winds enhanced cooling. What would ice up first? You know what...the elevated roadways which did not enjoy heat conduction from the relatively warm ground below. The Alaskan Way viaduct iced. The West Seattle Bridge. And since much of I5 is elevated, it glazed over rapidly as well. Icemageddon.

Traffic locked up on major roadways. Plow and sanders couldn't get to where they were needed. Trucks and buses got into trouble. And the rest was history.

What to Do

What I am about to express is opinion...and I am probably missing key points...but I will go ahead anyway.

First, although weather forecasts are getting better, any new system for dealing with snow has to be robust enough not to depend on the forecasts being correct in the timing or amount of snow. It will be 5-10 years before the 12h forecasts are dependable enough for such work. We are quite good in telling you if the cold and winds will come. Or revealing a threat. But getting the exact amount and distribution of snow even 6-12 hr out is not here yet.

The Nov 22 forecast by my colleagues in the NWS were far better than what they could have done 10 years ago. It was good enough to alert the city and various DOT agencies, and to let the general public know that something serious was possible. Certainly KING TV and other stations knew--they were hyping it up like mad the night before. Jim Forman was getting his famous parka pressed and readied.

But if the forecasts are not perfect, what is needed is good nowcasting--a term in my field which means examining current observations carefully and intelligently extrapolating them into the future. There are 50-100 weather stations reporting in real time in the city. With this information, one could determine exactly what the temperatures are and track the changes. As soon as the strong winds and colder air started to push in, it was time to get out there getting rid of snow on the roadways and hit them with lots of salt. Using the weather radar and temperature information it is also possible to determine the snowfall patterns over the city (this will get even better next year with the NWS updating of all local weather radars to dual-polarization and the addition of the new coastal radar). With the information about how much snow is on the ground, where it is falling, and how temperatures are changing, SDOT and WSDOT should be able to do their work far more effectively...particularly in getting ahead of the storm. A software system could be created to pull all this information together...we could call it SNOWWATCH. Furthermore, the city needs someone with meteorological training watching all the observations in real time during these events.

Once the ice forms, you are in trouble. The key is to know when snow is falling and to plow as much of it as possible off the roads and then hitting it with salt (my friends in the business suggested prewetted salt when temps are cold). If the snow keeps up, you have to repeat.

Now at around 3 PM it was clear from the weather observations that bad things were about to happen. The surface chart showed northerly winds starting to pick up and cold air moving in from the north (see plot). The radar showed snow over the region (see plot). Click for big version.


3PM surface observations

Conclusion: it was about to get colder, winds would increase and the threat of icing was about to increase rapidly. At this point, all equipment needed to be used on elevated structures immediately, and when those were cleared and salted (solid not brine), then the other roads could be dealt with. Metro needed to pull all their articulated buses off the elevated roadways at this point...in fact, they should have replaced with with the non-articulated fleet hours before. Rapid deployment when the weather was clearly going to change seems to me the only viable option.

Question: Do any of the roadway surfaces in the city have real-time temperature measurements? If not, shouldn't this be fixed immediately?

In summary: I am suggesting a combination of the intensive use of all observational assets to provide a real-time view of the weather and road conditions around the city, and the flexibility to use the limited assets of the city and WSDOT to hit the big threats first, guided by these observations. The current state-of-the-art of weather forecasts are good enough to give a heads up, but not good enough today to guide hour by hour actions.

Eastern Washington Gloom

| comments

8 PM Update...the Huskies DID win and will be going to a bowl game!

You think of eastern Washington and what are the first thoughts that come into your head? Dry--no doubt. Sunny and warm? Well for the warmer half of the year this is true...but eastern Washington has its dark side...the tendency for low clouds and fog to collect there from November into February.

The last few days have been good examples. Below are two satellite images from yesterday (Friday, Dec 3). The first from the usual NWS operational satellite and second from the high-resolution MODIS satellite.

Eastern Washington is full of low clouds and fog...and you can see a line of low clouds in the Willamette Valley (also a foggy place), the Chehalis Valley and portions of the Puget Sound basin. In the latter the fog tends to burn off to a much greater degree than eastern Washington.

Foggy conditions tend to occur when high pressure is over our region--bringing light winds and relatively cloud-free conditions aloft. In such situations the earth can effectively radiate heat to space, cooling the surface down to the dewpoint...thus the clouds and fog. Mixing from wind helps to dissipate the low clouds...and this is where eastern WA has a big problem...it is in a topographic bowl. Here's the proof from a google topographic map:

Eastern Wa is surrounded by the Cascades to the west, the Okanogan Highlands to the north, the Rockies to the east, and the Blue Mts to the southeast, with higher terrain north of the Columbia River finishing the enclosure. So on these cold, high- pressure days the cold air collects and deepens in the basin, with a stable inversion capping the cool layer. The clouds are good at emitting infrared to space and maintaining themselves. The result--one gloomy situation.

In Spokane, the number of overcast days per month for November, December, January are 17, 21, and 10, with the corresponding number of heavy fog days (1/4 mile visibility or less) being 8.5, 11.7 and 9.3. You will need vitamin D there for sure.

But wait! There is something else--freezing fog. Since there is often subfreezing temps while this fog is around, the roads are often glazed by dangerous freezing fog. In fact, the National Weather Service has had a freezing fog warning out for several days now.

Fortunately, there appears to be a break in the fog over Pullman for the Apple Cup game...an intervention by higher powers that is a sure sign that the UW Huskies will win. However, if my ability to forecast the weather is admittedly uncertain and my bias in this matter self-evident, I suspect my skill in predicting football scores may be questionable.

Climatologically, The Worst is Over

| comments

It may seem really strange, but on average the worst of the winter is over and its all uphill from now on. Strange, but true!

Here are the facts. Look at the plot of average rainfall per day at Sea-Tac Airport:

The period of highest average precipitation per year--ranging up to .3 inches per day--is in November, with the last half of November being the wettest. Then in December things improve, with a substantial decline in daily average values (to around .2 inches per day). January has similar daily rainfall, which is followed by the LONG, SLOW decline in late winter, spring, and early summer to a minimum in July.

What about daily extreme precipitation? Check it out below:


There is improvement in the middle to end of December, with worst in late October into the first week of December.

So this is pretty amazing...we ARE THROUGH the worst of the rain, on average. Interestingly, the jet stream--which directs storms towards us and is essentially the source of energy for the storms...weakens in December versus November over the Northwest. To show that, below are the winds at around 18,000 ft (really 500 mb pressure) averaged over November and December 1979-2008. The changes are perhaps subtle, but significant.

If we looked at surface winds, a similar story would be evident..the end of November is ground zero for rainy, stormy weather and the situation improves in December.
And certainly the first week of December this year is going to seem like a walk in the park compared to what we had at the end of November.

But the worst is yet to come for one parameter...snow. As shown below for Sea-Tac, January is the snowiest month in our area. KING-5s Jim Forman better keep his parka handy and the Mayor might insure his staff is ready for action! However, the next several days looks completely benign and boring...no strong storms or heavy precipitation in the offering, and Saturday might even have some sun!


Support : Creating Website | Johny Template | Mas Template
Copyright © 2011. The Weather - All Rights Reserved
Template Created by Creating Website Published by Mas Template
Proudly powered by Blogger