Coldest Spring Confirmed with Barbecue Index

| comments

Today we are getting a break from the cold (more on this later). But I thought it would be interesting to unearth the old "Barbecue Index"---the number of days we have hit 60F or more this spring (to be exact from March 21st to May 11) at Sea-Tac Airport. This is the kind of rigorous research one expects from the UW!

The answer: the index shows this is the WORST YEAR since record-keeping began at this location with only five days reaching 60F. Here is the plot (courtesy of Neal Johnson of the UW):

Even more irritating to many is the trend of the past 7 years---downward.

A big question is whether we are going into a cold (negative) phase of the Pacific Decadal Oscillation--a natural variation over the eastern Pacific basin (see PDO index below). We were in a cold phase during the fifties to the mid 70s, followed by a warm phase until the early 2000s. But what are we in now? A new cold phase?


Here is an amazing image....it shows the difference (anomaly) between the temperature in the lower atmosphere (850 mb--roughly 5000 ft) and normal (climatology) considering the period from March 15th to May 11th. Very large cold "bulls eye" over the Northwest, while a warm center is found over Texas. Says it all. It also illustrates why you can't talk about global warming my looking at ONE location---we might be cold, while others are warmer than normal.

Many of you are asking about this summer. We are now in a rapidly weakening La Nina and our forecast models indicate a cool period later this weekend into early next week. No major warm ups in sight for next week. This summer we will be in a neutral pattern (neither La Nina nor El Nino) and in any case we have little if any skill for summer predictions. So I can't tell you and neither can anyone else.

But one positive....today we will get into the mid-60s and Saturday will be decent (low 60s with increasing clouds) and generally dry (few showers at most). But Saturday night we head back into serious rain and Sunday will be a loss....cool and wet again. In any case, this is better than droughts and wildfires (Texas), tornadoes (Alabama), or flooding along the Mississippi. Or the extreme snow of the eastern U.S. last winter.

Lets face it, weather is rarely normal, particularly if you look across the entire continent. We need to learn how to better predict it (my field's job) and adapt to it (everyone's job). You don't live in mobile home parks in tornado country if you can help it, nor by a large river that periodically floods.

Another Record Cold Month?

| comments

Folks, I don't have good news. During many Mays there is a period of warmth....real warmth...somewhere in the middle of the month followed by a return to clouds and the typical June gloom. But I am not optimistic right now that we will get our warm spell...

To "warm up" this blog, lets start with the temperatures at Sea-Tac the last two weeks as well as the normal highs and lows:Only two days of the last 14 have reached the normal highs, and none have exceeded normal. Today we had a ridge (see upper level map for this afternoon) over us and the clouds finally dissipated during mid-afternoon

....very nice for a while. Here is an educational video of today's clouds. First we start with the low murk coming out of the south, then mid-afternoon it breaks and you can see the large wind shear in the vertical, with westerly winds aloft. Later in the afternoon, high clouds start pushing in aloft and if you look carefully you will see a 22 degree ice cloud halo around the setting sun.


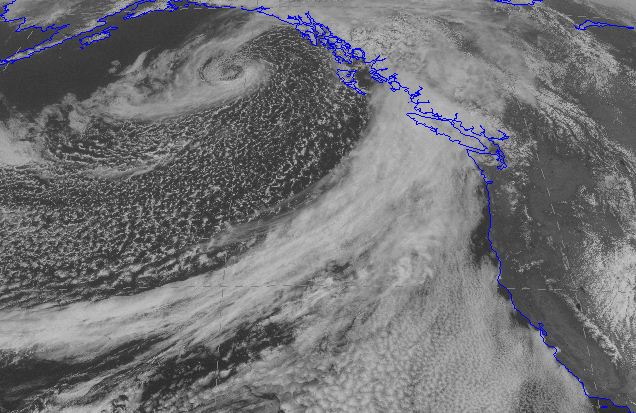
But it won't last. A moderately strong front is bearing down on us and tomorrow will dawn cloudy with rain by midday. Here is the visible satellite image for this afternoon. Very nice front stretching from Vancouver Is. to the the southwest. A large field of low clouds off of California (very typical in spring). You can tell they are low because they don't push past the coastal mountains. Behind the front you can see the speckled instability clouds (open cellular convection in the biz) associated with cold air and a nice little low is spinning around in the Gulf of Alaska.


Now the depressing part.

You see the deep trough over the Gulf of Alaska in the upper level weather map above? Such troughs are associated with low -evel cold air. That trough is going to move south and the settle over the eastern Pacific for a long time. I mean a LONG time. Here are the forecasts for Friday afternoon and Monday morning:

Upper level troughing dominates the entire period! Let me put it diplomatically....this is NOT a warm pattern for us and it will produce highly anomalous cold and precipitation into central and northern CA.

Well, what do my friends in the National Weather Service have to say? Here is the 6 to 10 day temperature forecast probabilities. It is probable that whole West Coast will be colder than normal and northern CA and southern OR WAY colder than normal.


And precipitation for the same period? Do you have to ask?

Coastal Radar Site and The Radars You Don't Hear About

| comments

Several of you have asked questions about the new coastal radar at Langley Hill. To address these inquiries I have created a web site dedicated to this new system (click on link to open):

http://www.atmos.washington.edu/~cliff/Langleyradar.html


If there is anything I am missing, let me know. The site will be regularly updated.

There some other local radars you might not know about. For example, at Seattle and at Westport there are two radar wind profilers. I have shown you the output of this machine quite a few times. Here is a sample:

The plot shows the winds and temperatures from the surface to 2-km in time for ONE location: Seattle Sand Point. Very different from radars, which give you lots of 3-D spatial information. But radars don't give you high resolution temperatures and winds above one point--something that can be very useful at times (like deciding how the freezing level is changing).

Here is what the device looks like (this is not the Seattle or Westport unit but ours look very similar):

The central unit is a Doppler radar with three beams: up and two perpenicular directions. Instead of tracking precipitation, they follow variations of atmospheric density. Doppler radars tell you whether the target is approaching or moving away, and it turns out that using the Doppler information from the three beams and a little trigonometry (that's right kids, trig has its uses!) one can figure out the winds with height. Pretty neat.

But there is more! You see those castle-like towers around the radar? Those are BIG speakers that emit powerful multi-frequency tones (you should hear my version of it!). This sound propagates into the atmosphere and disturbs the density variations aloft. The radar unit can then track the density variations and thus the sound waves. Since the speed of sound depends on temperature, this unit can determine the speed of the sound waves and thus temperature variations with height. The fancy name for this hardware is RASS--Radio Acoustic Sounding System.

In another blog I will talk about the Canadian and TV radars.....

Two nice days ahead, by the way. But don't worry, it won't last....

Northwest's Signature Cloud

| comments

If someone asked you what the number one cloud was over the west side of the Northwest, what would you say? The cloud we see most frequently during every season. The cloud that sends Californians back to their Jacuzzis in the Bay Area or LA.

There is little doubt it is the cloud we saw quite a bit of on Friday: stratocumulus.

Here is an example:

Stratocumulus is a relatively low cloud, with the entire cloud below roughly 8,000 ft and the base far lower. It is generally made up of large, dark, lumpy elements, with bright sections in between. They form in a generally moist lower atmosphere, where weak convection is blocked by a stable layer aloft. Most are completely dry (no precipitation), but they can produce light rain or snow.

Friday there was lots of these fellas: take a look at video from the UW looking towards the Olympics (see link below). As you watch the video I want you to notice something. Early in the video the cloud base was clear and distinct. During the afternoon the cloud base became blurry and you can't see individual elements.

That happens when precipitation starts. So if you see a cloud base blur....time to get your raincoat!


Progress on the New Coastal Radar

| comments


For those of us who worked on getting a coastal radar for over a decade, it is a great satisfaction to see work progressing rapidly now.

The Langley Hill site, 3 miles east of Copalis Beach on the WA coast, is now being prepared. The trees were cut down, the site was leveled, and the concrete pad with bolts for the tower have been installed (see images).

This project is moving quickly, as it must if the radar is going to be operational by the end of September. I am now building a web site, dedicated to the new radar, that will have constant updates. Not quite done, but a lot of content is already there:

http://www.atmos.washington.edu/~cliff/Langleyradar.html

One reason we need the radar is that the offshore buoys are rapidly destroyed by winter storms. Here is the latest buoy map, the red boxes represent buoys that are broken or lost.


Wintertime problems with the buoys was one reason that the crabbers and other fisherfolk were strong supporters of the radar.

At the UW we are now preparing a next generation data assimilation system that will be ready to take in the coastal and offshore radar data and use it to improve forecasts throughout the region. I am hopeful this system will greatly enhance 0-12 hr forecasts, including snow events like those of last winter where the position and intensity of coastal lows were important and often poorly forecast.

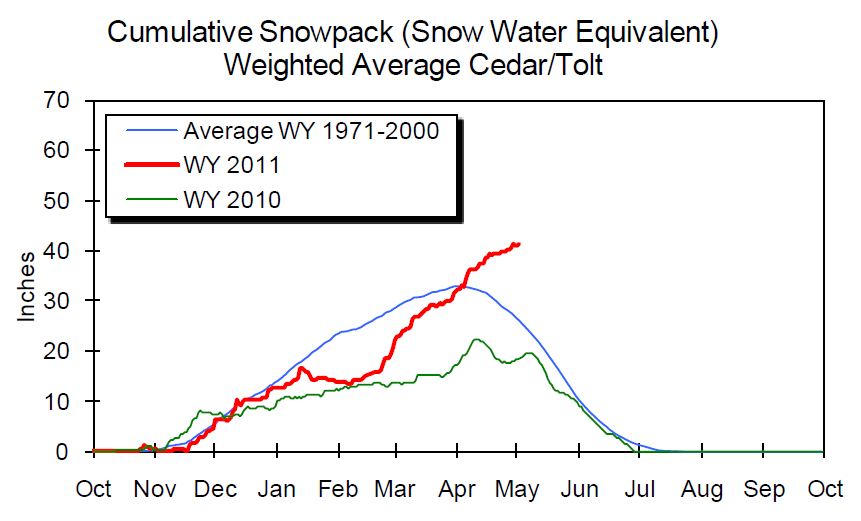
Finally, let me note the amazing amount of snowpack we have right now and I wanted to share a startling graphic. Here is the cumulative snowpack supplying Seattle's watershed (Cedar/Tolt combination) this season. The snowpack is JUST peaking now...and it is currently as high as it has been all winter. In a normal year it peaks April 1---we are peaking May 1-ONE MONTH LATE! And the snowpack is clearly well above normal now. Just as amazing is that we were well BELOW NORMAL on 1 March. The last two months we have seen a record-breaking accumulation.


No guilt in watering my lawn this year. But first it has to get warm enough for my grass seed to germinate.

Sustainable Seattle will be hosting a symposium about the effects of climate change on the Pacific Northwest's rivers, glaciers, snowpacks and shorelines, and the impact of all this on our infrastructure and communities. The event will be on May 12 in Magnuson Park, featuring a range of speakers from government, academia and the private sector. See http://sustainableseattle.org/training/246 for more details, including the full list of speakers and online registration.

Why so few tornadoes in the Northwest

| comments

Several people have asked me during the last few days about why we get so few tornadoes around here and virtually never get the super destructive types, such as the ones that devastated parts of the Southeast last week.

Let me begin by noting it is true, we rarely get tornadoes and severe convection, but rarely is not never. Here is an example of one that hit near Monroe:


The annual average number of tornadoes around the U.S. is shown below. We may be tops in airplane and system software production, but we are in the junior leagues for tornadoes: average of one per year in Oregon and Washington


If you look at the frequency of severe thunderstorms you can see a similar pattern (see below-darker reds to brown mean more severe thunderstorms). Coastal Oregon and Washington have the least and Oklahoma and adjacent plains are pummeled. It turns out the high plains of the U.S. get more severe thunderstorms than any place on earth.

So why are we in the bush league when it comes to tornadoes and heavy duty convection. Well, the key reason is that we don't get many thunderstorms and our thunderstorms are wimpy! Look at this map below-- the West Coast has roughly ten a year while the Great Plains and Southeast can experience 60-100 a year. Tampa gets more than anywhere else in the U.S.


The reason for this pattern is the cold Pacific ocean and warm Gulf of Mexico. Thunderstorms like two things: lots of moisture in the air and big change of temperature with height--normally from a warm surface. Well, the Pacific is COLD, even in the summer (50F about tops it out), and cold water cannot put much water vapor into the atmosphere and keeps the surface cold. BAD FOR THUNDERSTORMS! And we get thunderstorms that are generally pretty pathetic. If ours get to 15,000 feet it is cause for wonder, in the Midwest 50-60,000 ft is not unusual.

Why so vigorous in the eastern portion of the country? Warm water, with the summertime Gulf of Mexico getting into the 80s and higher, pushing huge amounts of water vapor into the atmosphere, and keeping the lower atmosphere nice and warm.

And there are other reasons why Oklahoma and vicinity gets the strongest storms on planet---there is often strong wind shear (southerlies at low levels and westerlies aloft) there , which really helps the storms strengthen, and dry air aloft coming from the Rockies and Mexican plateau. Turns out dry air over very moist air helps support convection.

So if you want to study severe convection, don't come to the UW...head to the University of Oklahoma, and the barbecue is better there too. And you won't have much hiking or skiing or boating to distract you from your studies (see typical OK picture below). And there are basketball team rustlers there.

But if you love orographic precipitation or huge cyclones with powerful winds, you can't do better than here. And much better salmon.

Finally, let me remind you about the NW Weather Workshop on May 13-14th. You need to register for this if you want to go. Details on the right.

And one more announcement:

Sustainable Seattle will be hosting a symposium about the effects of climate change on the Pacific Northwest's rivers, glaciers, snowpacks and shorelines, and the impact of all this on our infrastructure and communities. The event will be on May 12 in Magnuson Park, featuring a range of speakers from government, academia and the private sector. See http://sustainableseattle.org/training/246 for more details, including the full list of speakers and online registration.

Warm Tomorrow

| comments

Today will be a transitional day with low clouds slowly burning off and few residual showers (see satellite pic at 10:15 AM). Want sunny skies for sure? Head just east of the Cascade crest and down into eastern Washington. The air is still cold aloft so we could get some instability and cumulus development, but that will be increasingly suppressed by high pressure building aloft.


Here is the 2 PM Satellite picture.... you see the mottled effect over land...but not clouds over water? A beautiful exam of surface heating causing lots of cumulus!


Here is the upper level (500 mb for tomorrow)--strong ridging over us and ridges are associated with sinking motion, which works against cloud formation.


With strong sun (the intensity today is like mid-August!) and warming temperatures aloft as the winds in the lower atmosphere turn southerly, temperatures will jump on Sunday into the 60s and even some lower 70s west of the Washington and Oregon Cascades. (see forecast for tomorrow afternoon from probcast). Summer will hit the Willamette Valley!

But another trough and an accompanying Pacific front will arrive on Monday...so this warmth won't last.

It is now certain that we will have the coldest April (maximum temperature) on record for Sea Tac (since 1948). And their are a whole collection of other regional cold records that will be broken as well. This month will be Portland's coldest April in 36 years as well as third wettest in history (1940-2011) at the Portland Airport. Astoria, Oregon has still not reached 60 degrees this calendar year, smashing the old record of April 19th 1945. I could go on and on, but I suspect you don't need much convincing.

Many of you have asked what this all portends for this summer's weather. To be honest, I can't tell you--there is simply no relationship that I know of that can provide a useful answer. One thing for sure...there will be plenty of water supply this summer for irrigation and power generation. And this says NOTHING about global warming.

Are the Eastern U.S. tornadoes and our cold weather connected?

| comments

We are about to finish the coldest April in at least 60 years. And it appears that April will bring the all-time record number of tornadoes to the U.S., including yesterday's catastrophic event with over 250 deaths.

Are they connected? I think one can make a very plausible case that they are.

But before I discuss this connection, let me note that around 6 PM tonight a funnel cloud was observed near Mt. Vernon. You can tell how unstable the air is around here with all the towering cumulus and cumulonimbus. Here is a video of the Mt. Vernon funnel and a good still picture, courtesy of KOMO TV:


Returning to the April records. It is now clear that we will break the all-time-record for the coldest average maximum April temperature at Sea-Tac airport---and plenty of other local observing locations will report similar records.

There is a particular and highly persistent flow pattern that has been associated with our cold and I have illustrated that below. This figure shows the flow at 500 mb last night--actually it gives the height of the 500 mb pressure surface above sea level. Winds are nearly parallel to those lines. Yellows indicate low heights in troughs. You will notice one trough just east of us that has brought cold, unstable air into the Northwest. The places where the lines are close together are associated with strong winds--which we call the jet stream when it is strong and extensive enough.


Anyway, with a trough over us the jet stream heads farther south than normal--directed towards the southeast U.S. The upper flow is wave-like so that a trough over us generally means a ridge over the Rockies and a trough somewhere over the eastern U.S. This trough...which is clearly evident in this image...is ideally situated to provide all the ingredients for severe convection over the SE--moist air from the south, strong uplift, large wind shear in the vertical. This flow pattern has developed repeatedly this month.

When I saw this configuration setting up, it provoked me to suggest in my previous blog that severe weather was a possibility over the eastern U.S., and I was not the only one to see this. But no one knew it would be this bad .

Thus, I believe that there was a direct and compelling connection between our historic spring cold wave and an historic tornado month over the eastern U.S.

An interesting note is that the largest tornado event in U.S. history, the super tornado outbreak of April 3 - 4, 1974, occurred in a La Nina year, as we are this year.

Finally, let me note that the National Weather Service did a very good job in forecasting and nowcasting (providing constant updates) on these severe storms. The fact that so many people have died shows the unique severity of this outbreak and how much effort is still required in spreading warnings and insuring that people take shelter. Another issue is the vulnerability of mobile homes to strong winds.

Making Fun of Weathermen Reaches New Depths

| comments


Weatherfolk are often the butt of jokes and I have experienced that many times myself. How many times have I heard snide remarks about weather forecasters predicting with dice, that "meteorologists can be wrong 50% of the time and still get paid" and similar comments. You get a thick skin eventually or leave the field.

But I have to admit that many of us in the weather community are not a little upset with the latest Subaru ad campaign: "The weather doesn't matter if you have a Subaru" .

The main character of this campaign is "the world's worst weatherman." Want to see him in action? Take a look at one of their clips:


INSULTING! And worst of all, especially for me, he says he is not good with numbers and that is why he became a weatherman. You know how I feel about that! Math is critical to being a good weatherman.

But it gets worse. Here is the Subaru weatherman's take on being a storm chaser (click on image for video)

Did you notice the guy looks quite a bit like the Verizon's "do you hear me?" spokesman? As if all weathermen look like geeks with greased-back hair!

And there are other videos, including one in which the Subaru weatherman locks his keys in a running vehicle.

But there is more, much more.

They have a calculator function on the Subaru website on HOW MUCH TIME YOU HAVE WASTED THINKING ABOUT THE WEATHER. Can you imagine that? Thinking about the weather is NEVER a waste.

Lets say you are 40 years old and spend 3 hours a day thinking about the weather. That is not much. Hell, I spend at least 10 hrs a day thinking about weather, sometimes more. OK, assuming 3 hrs a day and forty years old, their calculator tells you that you have WASTED over three years. Outrageous.

I was so incensed that I called University Subaru to complain. The sales manager listened to me patiently and told me I was completely wrong. " Subaru actually loves weathermen" he said and particularly the ones that exaggerated snowstorms and bad weather. He explained that since most Subarus had all-wheel drive, sales surged as conditions got bad. I asked him who his favorite weather person was and he immediately answered Jim Forman of King TV. I had to stop myself from saying anything more.

I am in the market for a new car, looking to replace my trusty 19 year old Ford Taurus, and I was going to consider Subaru products. No way now. I am going to boycott them until they become more weatherman friendly. And so should you.

Thanks, Budget Cuts, and an Inside Look

| comments


I would like to begin this blog with a heartfelt thanks to all of you that have contributed to the UW weather prediction research fund noted in the upper right of this blog and here. Over one-hundred of you have contributed both small and larger amounts and these funds (several thousand dollars so far) will help maintain our regional weather research and our real-time local weather prediction models running. Others contributed to the student scholarship fund, which is extraordinarily important as tuition zooms and financial pressure on our students increase.

It is really impressive that there is a community of Northwest residents who are so committed to keeping the collection of regional weather data, state-of-the-art weather models, and local forecasting research going in this period of cutbacks and retrenchment.

And the support is truly needed. This month for example, I learned that the funding I had gotten from the NWS for over a decade is ending due to their cutting of university funding in half. This was the money I was going to use to assimilate the new coastal radar into our local weather prediction efforts! Anyway, with your support I will work to keep our efforts going.

But since you are investors in our regional modeling, let me give you a little glimpse "behind the curtain" to see what you are supporting.

The local weather prediction computing facility is in the atmospheric sciences building on the UW campus. I have about two-hundred processors, most of them on dual quad-core servers (8 processors per board or node) and over 300 terabytes (trillion bytes) of disk storage. And to keep the thing running when lights flicker, there are uninterruptable power supplies (UPSs). Some of these processors can communicate through high-speed (40 gigabit per second) interconnects. All this stuff is packed into several clusters in very special racks (more on this later). Here is an example of one of the clusters:


This computer facility is one of the greenest around! The UW didn't have enough funds to give us a decent air conditioning system, so we came up with our own approach...we blow all the hot air outside and bring in cool air from the outside to make it up! To make this work we got fancy enclosures with BIG fans inside them. It pulls air across the processors and then out big ducts to the exterior of the building. Here are two pictures of our Rube Goldberg set up:
Ok, it is not pretty. And the UW AC guys didn't like the looks of it, but it really works! It is like all the heat from the computers doesn't exist. We have a big intake in one of the computer rooms that brings in the cool outside air. Only when the outside air is hot (a VERY, VERY short period here in Seattle!) do we need AC and the weak units the university gave us, plus an auxiliary unit we bought, does the trick. Why use energy to cool hot air when you can get rid of it! If we were really clever we would redirect the computer air to the heat ducts of the building and no external heat would be needed. Is anyone designing buildings to do this? They should.

You know the WRF model I am always showing on this blog? Generally we run this 0n 64 processors simultaneously, in other words the code is parallelized so that the problem can be split efficiently on many processors. And fast communication between the processors speeds this up immensely.

This computers not only run the forecast models, but they include web servers and other needs. This is not an inexpensive enterprise, and that is why your help is so valuable. Disks continuously fail, UPS batteries die, backup tapes are continuously needed, and we find that we have to replace the processors roughly every five years. Our system programmers, Dave Warren and Harry Edmon, are marvelous in keeping the system going and it rarely fails (at least 99% availability). And the department charges us per processor for support.

The amount of data moving through the system is amazing. Every day we bring in hundreds of gigabytes of weather data (NWS models, satellite and radar data, surface obs) and we acquire the data from over 70 local weather networks...all in real time. The models we run produce hundreds of gigabytes more a day. And the graphics you see on the web....we produce over 50,000 images a day! A tape and removal disk back system allows us to save key observations and data --again more expense.

And then there are the people... right now I have 3 staff members who spend much of their time developing improved weather prediction systems and maintaining this enterprise. And of course the students who are doing their theses on understanding weather systems and developing future technologies--like figuring how to get the maximum benefit from the new coastal radar.

This all started in 1995 with a single processor computer.

Again, thanks for all your help...cliff

PDO and Long-Term Trends

| comments

Saturday's clear skies over nearly the entire state....you won't see this again soon!

After Saturday's spectacular sun and warmth, we have returned to normal again. Saturday was warmest day for the region so far this year, with temperatures climbing into the mid to upper 60s for most western WA locations away from the water. As expected some of the warmest temperatures were east of the Cascade foothills, where compressional heating from descending easterly flow and distance from the cold water allowed a boost into the lower 70s. North Bend, WA got to 71F for example.

Looking at the latest forecast model output, I am afraid that we have showers and cooler weather ahead of us this week.

Through April 20th, April temperatures for many observing sites (e.g., Sea-Tac) have been on the coldest on record--since roughly 1950. This is also true looking at the air temperatures approaching our region aloft in the lower atmosphere (850 mb--roughly 5000 ft--at Forks on the NW WA coast). Thus, by any measure this has been an unusually cold spring.

What does this all mean? What are the trends? Will moss take over our lawns forever? Several of you have complained that springs are getting worse lately--La Nina or not. So in this blog, lets look at some facts.

Here is a two-plot panel showing the trend in April temperatures in the lower atmosphere (mainly Forks, 5000 ft) and at Sea-Tac for the surface since 1948 (click to enlarge). The dots are the annual values and the other lines are curves fit to these variations with various degrees of smoothing. One is struck by the similarity of the long-term temperature changes in these two plots-- temperatures seemed to peak around 1990 and have cooled since. Temperatures were cooler in the early 70s back into the 60s.


Some researchers have suggested there is a multi-decadal variation in the atmospheric circulation over the eastern Pacific (period roughly 30 years) and have termed it the Pacific Decadal Oscillation (PDO for short). This oscillation influences temperature and snowpack over the NW. UW scientists (like Nate Mantua) have led the study of this feature and have even plotted values of a PDO index, shown in the figure below. Blue (negative values) indicate cold PDO (and generally colder and snowier over the NW), and red is warmer. According to this index, the PDO was associated with colder temperatures into the 50s into the mid-70s, and then began a warm-up phase. More recently, it looks like we may have headed back into a cold-phase PDO.

The trouble with this is that data before 1900 is really not good enough to tell whether this oscillation is robust over a long period and we really don't understand why it exists--just that there appears to be a natural mode of variation that predates any possible global warming forcing. As I have noted before, because of our position downstream of the Pacific, global warming will be weaker and start slower around here compared to most of the globe.

So where does this all leave us?

(1) It is clear from the above information and others, that the region has cooled the past few years during the spring. You are not crazy thinking things are getting worse.
(2) Such cooling is consistent with us going into a negative (cool) phase of the PDO.
(3) Natural variability like the PDO is probably dominant around here at this point in time...far more significant than any global warming signal.
(4) Eventually the PDO will switch into the warm phase and the global warming signal here will get stronger....so don't throw out your tee shirts yet. It is going to get warmer.

And one final note...the return to last week's pattern implies not only that we will go back to cool and wet weather, but the eastern part of the U.S. may be on tap to experience more savage storms. In fact, the computer models are predicting this.

A Great Historical Dust Storm and FINALLY a Warm Day

| comments

Today is the 80th anniversary of the greatest dust storm in the history of our area. On 21 April 1931, very high pressure developed over southwest Canada and eastern Montana, while low pressure deepened over the intermountain west (see figure, with sea level pressures).

Between these two features a HUGE pressure difference developed, which led to very strong winds...we are talking about 50-60 mph on both sides of the Cascades! These strong winds combined with a previous period of warm, dry weather and recently tilled fields to result in an immense dust storm.

Dust over the Columbia Basin turned the sun into a weak, reddish orb, car lights were needed during the daytime, and dust extended to 10,000 ft. Dust pushed westward through Columbia Gorge and lower Cascade passes, extending artificial darkness over the Willamette Valley. Continuing its eastward movement, the dust pushed out into the Pacific, where the freighter Maui ran into the cloud 500 miles off the coast!

The winds during this event were so strong that thousands of trees were uprooted and power failures extended over both sides of the Cascades. Someone should make a movie about that event.

Dust storms still strike our region, particularly eastern Washington during the spring. Such storms often result in multiple car accidents due to the poor visibility and yes, some motorists follow WAY TO CLOSE. Not any of you, of course. Here is some video of such an event:


http://www.youtube.com/watch?v=ca_6cbkSR60


And sometimes tumbleweed come with the dust:
http://www.youtube.com/watch?v=VrXObmAYNcA

And now the good news. The lastest model forecasts suggest that Saturday is going to be extraordinary--sunny and the warmest yet this year. REACHING INTO THE MID-60s over western Washington. Even upper 60s on the eastern side of the Sound due to easterly flow off the Cascades. Here are the forecast temperatures Saturday afternoon from UW PROBCAST:

Unfortunately, the sun won't last...with rain coming in on Sunday. So make your plans for Saturday.

Adult Theme Blog --Mammatus Clouds

| comments

This blog contains material that may be inappropriate for preteen audiences, so if you are underage, please click here.

For the rest of you, lets continue. A number of readers of this blog have sent me emails the past few days about some strange looking clouds. Here is an example provided by Pam Keeley of Columbia City:

Scary.

And our favorite high-definition time-lapse video provider, Dale Ireland of Silverdale, sent out this video yesterday showing the rapid formation of a similar phenomenon:


If you go to the second video, you will see another example of mammatus.

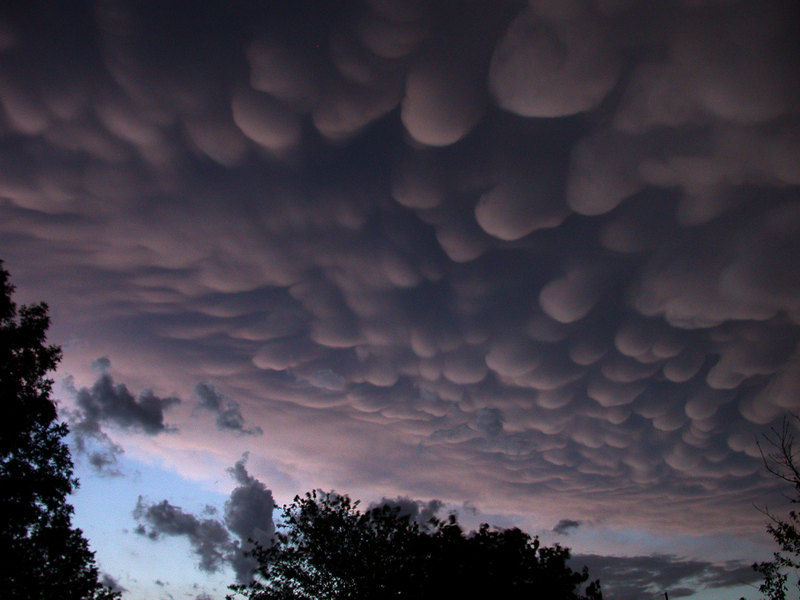
Both the still pictures and videos show evidence of sack-like protuberances extending below the cloud base---generally from base of the anvils of cumulonimbus clouds. Since they appear similar to female breasts (or udders if you know your way around cows), they are known as mammatus clouds. (that is about as racy as this blog is going to get).

Mammatus clouds can really look quite extraordinary....he is a particularly dramatic example:
So what is the origin of these other-worldly clouds?

As noted earlier, mammatus clouds tend to form under the anvils of cumulonimbus clouds. Here are some schematics of cumulonimbus clouds (thunderstorms) that show the positions of the mammatus.

(M=mammatus)

There is some debate about the origin of these clouds, but the most frequently quoted explanation starts with the updraft sending lots of liquid water droplets or ice crystals in the anvil. The weight of all these particles results in negatively buoyant air (air denser that air around it) and this forces descent into the drier air below. This is just the opposite of normal convection you are used to, where warmer air rises to produce the turrets of convection. In this case, denser air descends producing downward-directed turrets. There are more details, of course, but you get the idea.

Just an amusing note to end. Some of use an IPHONE App by PointAbout, Inc. to view this blog. These folks produce all kinds of great weather apps (like IRADAR) and they did mine for free. For some reason, Apple gave this blog a rating of 9+ "Infrequent/Mild Mature/Suggestive Themes." I just can't imagine why!
Perhaps my talk about math education.....

Unstable Air and the Northwest Weather Workshop

| comments

Although the cold air that has been moving in aloft these days may have its down sides for gardening and some outdoor activities, there IS a silver lining to the situation....very nice cumulus and cumulonimbus clouds for viewing (an example shown above from the Puget Sound Clean Air Agency "Visibility Cam."

Believe it or not, the sun is actually getting fairly strong (the sun's strength today was the same as late August!!!), so the surface is getting quite a bit of solar radiation when the sky opens up. And the day is quite long now (like late August!).

Now the result of cold air aloft, but warming at the surface is that a large difference in temperature develops with height. In the business, we call that a large temperature lapse rate.

So why do we care about this? Well, when the lapse rate gets large enough the atmosphere can get unstable and it starts to convect. This is exactly what happens when you make hot cereal by the way (and if you don't eat hot cereal, you should, it is good for you). You put the a saucepan on the burner and when the vertical lapse rate because large enough the cereal starts to convect....some moving up and some moving down. Add some brown sugar...

Or you can see convection take place in a Lava Lamp--which those growing up in the 60s and 70s will remember well. Heating the lower portion causes colorful blobs to rise and then fall. Here is a video of one for the younger crowd:

People frequently ingested illicit substances while watching such displays, but meteorologists have no need for such aids--the convection is more than enough.

On these cool spring days you can watch the atmosphere go unstable--either by keeping your eyes on the clouds or by viewing one of the many cam videos--
My department has a good one:
http://www.atmos.washington.edu/~ovens/loops/flash2.cgi?/images/webcam2/movies/20110417.swf

By the way, spring is typically the most unstable time of the year around here. The atmosphere takes time to warm up and spring often brings some of the coldest temperatures aloft, while the strengthening sun causes the surface to warm up more quickly.

So put on a warm sweater and enjoy the convection...it is a great show, with some of the cauliflower-shaped cumulonimbus rising several miles into the sky.

Finally, let me note that the big local meteorological gathering of the year will occur on May 13-14th...the NORTHWEST WEATHER WORKSHOP. Meteorologists from throughout the Northwest gather to talk about the latest in our regional weather and layfolk (like most of you) are very welcome. Topics will include everything from radioactivity from Japan and the latest on the new radar and local modeling, to a panel discussion of the use of social media to communicate weather information.

The web site for the meeting, which included the agenda, is found at

http://www.atmos.washington.edu/pnww/

You can register for the meeting and/or the Friday-night banquet if you are interested.

Are Northwest Springs Getting Worse?

| comments

I have heard two questions over and over again this week:

Are springs getting worse?
Is this the worst spring on record?

Looking at the data one might argue that the answer to both of these is yes.

For me, it starts feeling spring-like when temperatures get over 55F. In the forties and lower fifties there is a chill in the air, but above 55F there is a different feel, and one doesn't need a sweater to work outdoors. Above 55F I can comfortably run in a tee shirt and shorts.

So let me propose a Spring-Fever Index that counts the numbers of days the temperature is above 55F from February 1 to April 14th. Why April 14th? Because today is April 15th! And April 15th (except this strange year) is tax day.

I think you are learning how science is done!

Now here is a plot of my spring-fever index for Seattle-Tacoma Airport from 1948 though 2011....the entire record at this site (thanks go to Neal Johnson of my department for gathering this data):

SPRING FEVER INDEX at Sea-Tac (click to expand)
The results are shocking, but no surprise to the wet, chilled residents of western Washington.

2011 is clearly the worst year on record with the fewest number of days above 55F!!!

Only two.

You would have to go back to the 1950s to find the runner up.

But it is worse than that.

The biggest decline in the number spring days between two years is between 2010 and 2011! Just like big changes in temperature can crack concrete, a big decline in spring temperatures in consecutive years can crack our spirits! And it has.

Just think of it, last year there were 26 days of ove
r 55F during the period, this year only 2.

A casual glance at this chart suggests the 1950s were somewhat chilly (there was a cold war then of course!) and temperatures warmed up into the early to mid-90s.

In 1992 there were 43 days above 55F! Forget Hawaii that year (1992 had a very strong El Nino)

The last decade has been generally cool except for a few isolated years, like 2010. And these cool years have been reflected in the Cascade snowpack, which has actually been increasing recently.

So it is not your imagination that this was an absolutely abysmal spring...one of the worst ever. Now part of the blame can probably be pinned on the strong La Nina of this winter, but not all, since this year is so extreme.

So the answer to our questions? Yes on both looks pretty good to me.

Eventually, global warming will change the trends upwards, but the coastal Northwest is one of last places on the planet that will experience warming because of our proximity to the slow-to-warm eastern Pacific.

The forecast for this weekend? Just showers, but considerably cooler than normal with temperatures dropping into the 30s on Sunday morning. Don't even think about putting any tomato plants out until June.

 
Support : Creating Website | Johny Template | Mas Template
Copyright © 2011. The Weather - All Rights Reserved
Template Created by Creating Website Published by Mas Template
Proudly powered by Blogger