
Here are the facts. Look at the plot of average rainfall per day at Sea-Tac Airport:
 The period of highest average precipitation per year--ranging up to .3 inches per day--is in November, with the last half of November being the wettest. Then in December things improve, with a substantial decline in daily average values (to around .2 inches per day). January has similar daily rainfall, which is followed by the LONG, SLOW decline in late winter, spring, and early summer to a minimum in July.
What about daily extreme precipitation? Check it out below:

There is improvement in the middle to end of December, with worst in late October into the first week of December.
So this is pretty amazing...we ARE THROUGH the worst of the rain, on average. Interestingly, the jet stream--which directs storms towards us and is essentially the source of energy for the storms...weakens in December versus November over the Northwest. To show that, below are the winds at around 18,000 ft (really 500 mb pressure) averaged over November and December 1979-2008. The changes are perhaps subtle, but significant.

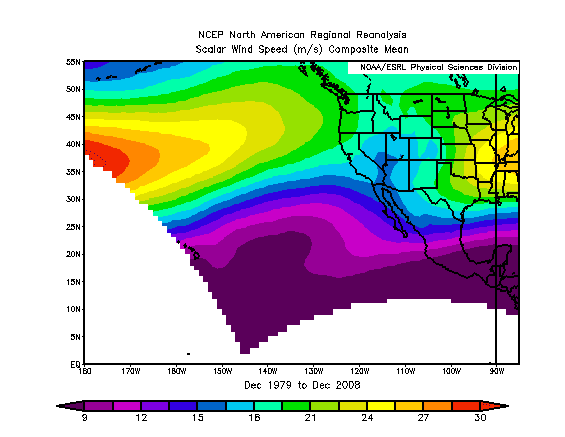
If we looked at surface winds, a similar story would be evident..the end of November is ground zero for rainy, stormy weather and the situation improves in December.
And certainly the first week of December this year is going to seem like a walk in the park compared to what we had at the end of November.
But the worst is yet to come for one parameter...snow. As shown below for Sea-Tac, January is the snowiest month in our area. KING-5s Jim Forman better keep his parka handy and the Mayor might insure his staff is ready for action! However, the next several days looks completely benign and boring...no strong storms or heavy precipitation in the offering, and Saturday might even have some sun!


