Lost Cats and Heat

| comments

A week ago I received an unusual call from Eric Swansen, Managing Director of the Regional Animal Services of King County.

He had looked at the statistics of lost cats and thought there was a temperature relationship...more cats being brought to the shelter during and after periods of warm weather.  Eric has a spreadsheet with the cat intakes and he asked whether I would get the temperatures and we would see the relationship with lost cats.


I asked UW staff member Neal Johnson to get me the Seattle-Tacoma Airport data and I made a few plots.  Lets take a look! (see below).  The light blue line is the daily average temperature and the dark blue lines are cat intakes into the county animal shelter in Kent.  The period ranges from the beginning of  2007 to a few weeks ago.

Eric Swansen was right!  A lot more cats show up at the shelter when the temperatures are warm during mid-summer than during the winter.  We are talking about roughly a 4 to 1 ratio.  Cooler summers, like the last two, have had less stray cats.  But there does seem to be a long-term trend independent of temperature, with less cats coming to the shelter.

Talking to Eric we speculated why this relationship with temperature occurs.  One possibility is that people leave their doors open more during the summer or let their cats out more when weather is warm, and a certain percentage get lost.   He also suggested that cats tend to go into heat when temperatures warm (spring and summer), and thus we would expect the maximum input of kittens to come several months after warming weather.  

To get a better idea of the phasing of temperature and cat intake at the shelter, here is a blow-up of the first year.  Not much of a phase difference...temperature peaks in July and August, while cat intake is pretty high and flat from June to early October.   This is out of my area of expertise!
Just to completely nerd out on you, here is a scatter diagram showing the relationship between cat intakes and temperature, with a trend line added.   
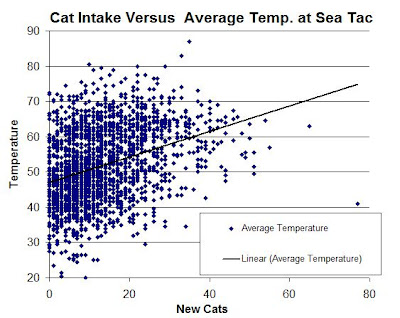

Clearly, there is a relationship between temperature and cat intake, but there is a lot of scatter and variability in the relationship as well.    Just like the temperature impacts of greenhouse gases on global temperatures! (sorry, couldn't help myself).  The other possibility, of course, is that temperature is just a proxy for season and that the role of temperature itself is less central.

Eric and I talked about the lost dog/cat problem and we agreed that so much could be done using social media and the internet to RADICALLY improve the situation.

Right now there are many separate lists of lost or found animals (e.g., King County's, Craig's List, etc.) and some animal shelters have no electronic lists or online web information (e.g., PAWS).    To start, we need all shelters to list their animals, with pictures, and to bring it all together in one master list that is easily searched. 

 But this is just a start.  We need smartphone apps where you can snap a picture of stray animals and quickly send it to a central site, where the geo-located pictures could be logged and put online.   Could you image the power of this?  Many folks don't want to approach stray animals, but would be happy to snap a picture of one!    My gut feeling is that we could radically reduce the number of lost pets with a modest investment in technology.  And I suspect there would be many volunteers that could help make such an advanced system a reality.  Such a system could be self-supporting as well, since many folks would be happy to pay a reasonable fee for help in getting their loved pet.   

We pride ourselves in leaving in one of the high-tech capitals of the world--we should have the most advanced stray animal recovery system in the world!


Old Technology


Announcement: Columbus Day Storm 50th Anniversary Gala at the UW: Oct. 11, 7:30 PM

On Thursday evening, October 11 at 7:30 PM, the UW will host a gathering to review and remember the 1962 Columbus Day Storm (October 12th will be the 50th anniversary).  I will discuss the major aspects of the storm and windstorm chronicler Wolf Reed will tell even more.  The Mt. Hebo radar dome broke apart that night as winds gusted above 150 mph, and we will have an eye witness account.  And there will be time for your comments, questions, or stories.  Steve Pool of KOMO TV will MC.  This meeting should be great fun will take place in Kane 120 on the UW Seattle campus.  You need to register for this if you want to go, since I expect it to fill.  To do so, go here.  The gathering is free, but the expenses are being covered by my research fund, so any contributions to offset the costs are very welcome. 


Extraordinary Asian Smoke versus the Perseid Meteors

| comments

Dense smoke from Asian fires has again spread over our region, profoundly degrading visibility.

Here is a MODIS satellite view from earlier today:


The smoke continues into British Columbia and Alberta:

There should be some amazing sunsets in the Northwest tonight from the smoke.  Some of the smoke is mixing down, reducing visibility and air quality near the surface.  Look at the amount of small particles (PM2.5) at the Cheeka Peak observatory on the northwest corner of the Olympics (see graphic below).  You can see the big rise in the number of particles today.


 Yesterday we could see the smoke approaching our region:

The European Center for Medium Range Forecasting successfully predicted this outbreak and suggests that it is not over.  The forecast for today at 5 PM is shown below.  Notice where the burning aerosols come from:

 Here is the forecast for Saturday at 5 PM. Perhaps a slight break, with more on the way.


This summer is clearly the most polluted from Asian smoke since 2003.  It is extraordinary that fires over Asia can have such a profound influence on air quality over the Northwest U.S., many thousands of miles away.

Now the big question is whether this smoke will significantly impact the viewing of the Perseid meteor shower, which hits its peak this weekend.   The sky will be relatively clear of clouds.  The moon rises about 12:30 AM tonight and an hour later the next day.   So take a look outside just after midnight if you feel lucky.  Sound like something Clint Eastwood would say.

Announcement: Columbus Day Storm 50th Anniversary Gala at the UW: Oct. 11, 7:30 PM

On Thursday evening, October 11 at 7:30 PM, the UW will host a gathering to review and remember the 1962 Columbus Day Storm (October 12th will be the 50th anniversary).  I will discuss the major aspects of the storm and windstorm chronicler Wolf Reed will tell even more.  The Mt. Hebo radar dome broke apart that night as winds gusted above 150 mph, and we will have an eye witness account.  And there will be time for your comments, questions, or stories.  Steve Pool of KOMO TV will MC.  This meeting should be great fun will take place in Kane 120 on the UW Seattle campus.  You need to register for this if you want to go, since I expect it to fill.  To do so, go here.  The gathering is free, but the expenses are being covered by my research fund, so any contributions to offset the costs are very welcome. 

Climate Distortion

| comments

This week, with great fanfare,  NASA scientist James Hansen and associates released a paper "The Perception of Climate Change"  in the journal PNAS that claims that recent heat waves and droughts were caused by human-induced climate change.  To quote their abstract:

" It follows that we can state, with a high degree of confidence, that extreme anomalies such as those in Texas and Oklahoma in 2011 and Moscow in 2010 were a consequence of global warming because their likelihood in the absence of global warming was exceedingly small."

This paper (found here) has been quoted in hundreds, if not thousands, of media outlets and newspapers and has garnered the praise of many environmental advocacy groups.

The problem?  Their conclusions are demonstrably false and their characterization of the science and statistics are deceptive at best. 

And the problem goes beyond this unfortunate paper.  It extends to the way the media has misunderstood and miscommunicated our current state of knowledge of climate change.  No wonder the public is confused, skeptic/denier groups hold on to wacky/unscientific theories, and our leaders dither on climate change.  And let me repeat something I have said several times....I believe that human-induced global warming is both observed, real, and a serious problem for mankind.  So if anyone wants to call me a denier or some other ad hominem name, please refrain from such remarks.

Well, lets start with a little test.

The heat waves/droughts in the mid-section of the U.S. during past two years were caused by:

a.  90% natural variability and 10% human-induced global warming
b.  50% natural variability and 50% human-induced global warming
c.  10% natural variability and 90% human-induced global warming

Time is up!  Write down your answer.  As I will try to demonstrate, the correct answer is probably very close to (a).  90% of the temperature anomaly this and last summer is the result of natural variability with a minor assist from global warming.

Really different than the impression you are getting from Dr. Hansen and the media, right?  But it is the truth.

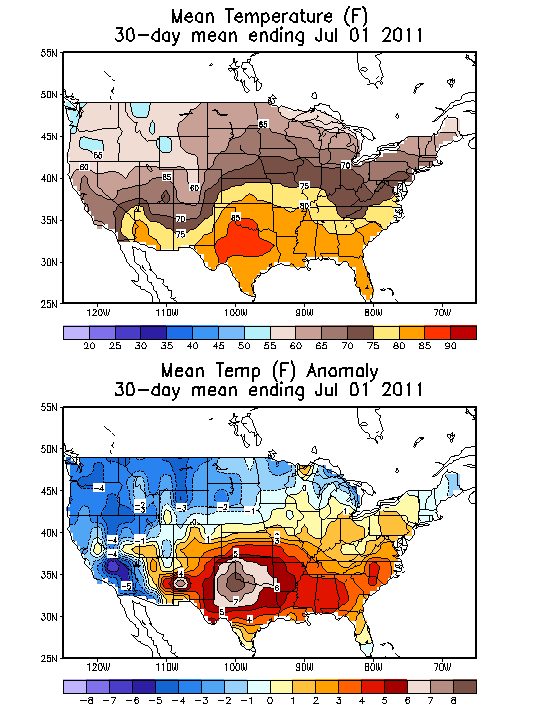
Let me prove to you now that Dr. Hansen's claims are  deceptive.  Consider the heat wave in  Texas/Oklahoma last year.  Below you will find the mean temperatures for July and August over the U.S. (top panels), while below are the differences (anomalies) from normal (or climatology).  The anomalies were over 8F in July and over 7F in August.


How big could the global warming signal be?  And particularly the warming due to mankind's emission of greenhouse gases?  The IPCC is the world scientific body that has examined such questions.  They note that human influence should have become significant somewhere in the mid-70s and the generally accepted estimated of the warming of the Northern Hemisphere since then is roughly 1F or  C (see IPCC graphic below).

Now this warming could well include some component of natural warming (particularly since there had been warming since the end of the 1800s).   But lets assume it is all due to human-emitted greenhouse gases. The full one degree F.

But what about Texas and Oklahoma?  The hemispheric value includes the Arctic over when the IPCC has shown the warming is far larger than anywhere else (due to melting sea ice for one reason).   Here are the temperature changes over all of Texas for June to August.   A big spike in 2011...but what about the long-term trend?   ...that would be the trend associated with global warming.  Nearly flat, but perhaps we can convince ourselves there was a small upward trend since 1970 of perhaps .5-1F.   And remember these observations are contaminated by urban heat island effects.

So I think you can see that the global warming signal due to human-emitted gases could not possibly be more than 1F, and is probably much less.  Yet the heat wave last summer, expressed as monthly anomalies, reached 7-8F over large portions of Texas and Oklahoma.

What can you conclude?  Something other than global warming produced the lion's share of the heat wave...and we know what it was:  a major change in the circulation over the U.S. last summer.  A big area of high pressure and high heights over the center of the U.S. The graphic below shows the differences of the upper level (500hPa) heights from normal over the U.S.  for last summer.  Green indicates above normal heights (a ridge) and blues indicate lower heights (trough).   So last summer we had a persistent pattern of mid-continental ridging and troughing on the coast.  This summer has been the same.  The upper level flow pattern has amplified in a wave-like way.

And there is no reason to think, based on theoretical or observational research that this is anything but natural variability. 
To put it another way: in July of last year, at least 7/8th (87%) of the warming was due to natural processes, and the truth surely was well over 90%.  It is funny that Dr. Hansen and others exaggerating the effects of human emissions don't say it this way.  The correct way.
The media, repeating this stuff, provides deceptive storiesy to their readers.  And the damage to the credibility of my profession is huge.

As an aside, the journal that this article was published in...the Proceedings of the National Academy of Sciences (PNAS)...allows members of the National Academy (like Dr. Hansen) to publish articles with essentially no peer review.  Until 2010 they could publish anything, with no peer review, and most recently the submission review is "supervised" by the submitting academy member WHO GETS TO SELECT THE REVIEWERS. Folks, this is really unfortunate for an entity that claims to be national journal of some reputation.  The result has been a lot of very bad papers in PNAS that would never have been accepted in real journals,with a real peer review process.  One could use stronger words, but this is a family blog.

So you think these exaggerations of Hansen and his fellow-travelers is bad enough?  It is much worse than that.   They spend a lot of time talking about statistics (bell curves) and how warming is producing more extremes.  But they don't give folks the straight story...let me explain.

Many atmospheric and other variables follow a bell curve (a.k.a. a Gaussian) in which most observations are near the mean and then the frequency drops away towards extremes on both sides (see graphic).  So the probability is highest that the observation is near the mean and probabilities drop for higher and lower values.  An important aspect of the bell curve is the standard deviation (indicated by Greek letter sigma).  You can calculate this number from the observations (I won't go into that here, but it is straightforward and in all statistics texts).  Turns out the that if the observation type is well described by a bell curve (and temperature generally is), 68% of the observations should fall within one standard deviation (one sigma) of the mean (both above and below).  The graphic shows this with the dark blue color.  Roughly 95% should fall within two sigma of the mean (dark plus medium blue), and roughly 99% within 3 sigma.  So very few observations..the most extreme should fall more than 3 standard deviations from the mean.

 Now as the earth warms up the temperature variations shown remain like the bell curve...or Gaussian, but the mean should shift to warmer temperatures (see the figure below). The result is that you get more warm extremes and less cold extremes (less cold extremes are not mentioned very often for some reason).


So the result is that you seem more warm temperature records and less cold temperature records.   We are in fact seeing this.  The earth is warming and there are more maximum temperature records than cold ones.  Hansen and friends make a big deal about this.

But what they are not telling you is that the very warm anomalies we are seeing today would have been nearly as large if global warming had never occurred.  In his paper he makes a big deal about large (three sigma) anomalies from climatology.   Well, without any global warming the anomalies might have been say 2.8 sigma.   Or in terms of terms, heat waves of 10F might have been only 9F if global warming had not occurred.  To say it differently, the impact of global warming due to greenhouse gases is still small compared to natural processes, and the impacts to society would have been pretty much the same.  But you never hear it this way.   Those exaggerating the global warming signal imply that we are going from normal conditions to extremes due to global warming.  In reality, we go from naturally induced extremes, to a bit stronger extremes due to global warming.

Let me say it am alternative way. You can see from the bell curve that the probability of a certain temperature changes rapidly when you are on the sides of the bell curve.  So if the bell curve shifts warmer, you get a big change in the probabilities of high temperatures.  So you get a lot more records even if the warming...and the impacts of the warming...are not that large.

Lets be clear here.  Although the global warming signal is relatively weak today in most of the planet (outside of the Arctic), our best science indicates that the warming will greatly increase by the end of the century.  At this point, the human-induced warming will be much more comparable to the natural variability and our climate will truly be different.

Unfortunately, a very limited, but highly visible, group of scientists like Hansen are choosing to tell a story that is not supported by the facts, with a media that is happy to amplify such claims.  Global warming due to greenhouse gas emissions of mankind is a very serious issue...one which our civilization is not dealing with in an effective way.  But scientists must give society the straight facts and not shade or exaggerate the facts based on our personal views on what should be done.

Announcement: Columbus Day Storm 50th Anniversary Gala at the UW: Oct. 11, 7:30 PM

On Thursday evening, October 11 at 7:30 PM, the UW will host a gathering to review and remember the 1962 Columbus Day Storm (October 12th will be the 50th anniversary).  I will discuss the major aspects of the storm and windstorm chronicler Wolf Reed will tell even more.  The Mt. Hebo radar dome broke apart that night as winds gusted above 150 mph, and we will have an eye witness account.  And there will be time for your comments, questions, or stories.  Steve Pool of KOMO TV will MC.  This meeting should be great fun will take place in Kane 120 on the UW Seattle campus.  You need to register for this if you want to go, since I expect it to fill.  To do so, go here.  The gathering is free, but the expenses are being covered by my research fund, so any contributions to offset the costs are very welcome. 

Amazing Mammatus

| comments

Announcement: Columbus Day Storm 50th Anniversary Gala at the UW: Oct. 11, 7:30 PM

On Thursday evening, October 11 at 7:30 PM, the UW will host a gathering to review and remember the 1962 Columbus Day Storm (October 12th will be the 50th anniversary).  I will discuss the major aspects of the storm and windstorm chronicler Wolf Reed will tell even more.  The Mt. Hebo radar dome broke apart that night as winds gusted above 150 mph, and we will have an eye witness account.  And there will be time for your comments, questions, or stories.  Steve Pool of KOMO TV will MC.  This meeting should be great fun will take place in Kane 120 on the UW Seattle campus.  You need to register for this if you want to go, since I expect it to fill.  To do so, go here.  The gathering is free, but the expenses are being covered by my research fund, so any contributions to offset the costs are very welcome. 
_____________________________________________

Sometimes the atmosphere produces images that leaves ones jaw agape.  Yesterday was such a day.  Many of you noticed a huge thunderstorm along the eastern slopes of the Cascades...a storm so tall (reaching roughly 35,000 ft) that it was easily visible from much of western Washingtion. (here is a picture taken by John Caldwell from Seattle.


This storm had a very large and prominent anvil, under which there was the most extraordinary field of mammatus clouds.  Here are some stunning pictures sent to me by John Stimberis of these features:


Pretty amazing pictures.   Some of you also saw some mammatus clouds on this side of the Cascades associated with the modest mid-level convection that moved over Seattle mid-day.

Why do we get these types of clouds?    They represent upside down convection...clouds that get cooler or heavier than their environment and convect downward...that is they sink!  Mammatus cloud are often associated with thunderstorm anvils. As updrafts carry precipitation-filled air to the thunderstorm top, upward momentum is lost and the air begins to spread out horizontally, becoming a part of the anvil cloud. Because of its high concentration of precipitation particles, the saturated air is heavier than the surrounding air and sinks back towards the earth. Evaporation and melting at the bottom of the cloud layer can also lead to cooling and downward convection.

Well you can't say this blog is not titillating.

No thunderstorms today on the eastern Cascade slopes...and the coming week does not look very unstable.


Mid-level Convection

| comments

Last night there was a weak push of marine air into western Washington that will take the edge off the heat today.  Related to my earlier blog, the thermal trough has moved into eastern Washington, easterly flow over the mountains has ceased, and there is an onshore pressure gradient, pushing marine air inland.   This was not a strong marine push and temps will remain at or a bit above normal today.

But something else is going on...a weak upper trough is moving northward through the region, and with relatively unstable air above, we are seeing a line of mid-level convection pass northward across the area.  Here is the radar image around 10 AM... the radar is seeing precipitation, but as we shall see, most of it is not reaching the ground.  Not much lighting..just a single hit in the last hour in eastern WA.

The visible satellite picture shows the line of showers very nicely.  You can also see the low clouds over the Pacific and the fact that some of the clouds started to move inland a bit.


 What is causing this line of clouds and showers?  An upper level trough moving northward--here is the model simulation for 11 AM...the red color is vorticity, a measure of the sharpness of the trough...red is more.
This feature is moving northward and the associated clouds should reach the Canadian border by dinnertime.  Even now, the clearing is approaching Olympia.

Most of the showers are associated with mid-level convection...and much of the limited precipitation is not reaching the ground...evaporated on the way down (see image from UW webcam).  This
morning I noticed so mammatus clouds....hanging hemispherical features extending below some of the cloud base (you can see a suggestion in the image above).  Really neat.  Here is what these kinds of clouds look like:
 So later today you will see clearing (except for the coast) and tomorrow could have some morning clouds that will burn off by lunchtime.   A step cooler and cloudier on Wednesday as the marine influence strengthens.  No heat wave for next weekend....


Is Algebra Necessary? Of Course It Is!

| comments

Last week an op-ed piece--"Is Algebra Necessary" by a Poltical Sciences Professor Andre Hacker--was published in the New York Times (link here).  The thesis of this note was that schools should stop teaching algebra as a matter of course, that algebra is really not necessary for most careers anyway, and that poor performance in algebra is having a terrible impact on high school and college graduation rates.

This article went somewhat viral:  securing over 450 online comments at the NY Times site, and was noted in newspapers, online media, and radio/TV stations around the nation.  I must have gotten a few dozen emails about it and talked to quite a few of the local media about it.

I have two major points to share.  First, the idea of dropping algebra is one of the most foolish ideas I have heard in a long time.  Second, the fact that the media took this wacky proposal seriously says something about where we are as a nation...and I will let you judge whether that is good or bad.

Algebra is fundamental for virtually all technical subjects and careers:  engineering, science, medicine, and technology.  It is required for finance and business.  The list is a long one.

Now even if we made the huge assumption that the only use of algebra is for technical and math-oriented careers, there is an obvious reason why we need to teach this subject to virtually all our children:   we don't know in junior high or even high school which kids are going into such careers!   If we deny a child access to this subject we are determining that they NEVER will be able to go into a technical or financial subject.  Parents--would you accept this?   Would a student like their future circumscribed in such a way?  Of course not.   We live in an increasingly technological society and many of the careers of the future require math competence.  It is inconceivable that we would deny our children the ability to participate in this new world.   Our international competitors  (e.g., Chinese, Japanese, Germans, to name only a few) are pushing their kids to achieve in math--they laugh at the intellectual disarmament that hacker suggests.  Today, foreign nationals are taking over the technical and mathematical subjects...even in our own universities.  Folks, this is bad, real bad.  Because our nation will not be able to swipe the cream of the worldwide talent pool forever.

But algebra is more than a foundation for key careers of the 21st century.  It is one of the prime achievements of our civilization and one that has greatly contributed to our ability to describe mathematically the world around us.  It is no less important that Shakespeare or Homer.  (any yes...how often do we use classic literature in our daily lives...would anyone suggest dropping these subjects?)

Learning math and algebra is a central part of the education of every student.  Not only do they learn how mathematics can describe the world around them and can do so many useful things, but they learn to organize ideas in a logical, ordered way--extraordinary training for anyone, of any career direction.

Hacker makes a big point that a lot of students are not gaining mastery of algebra and for many it is a frustrating experience.   But that is more of a measure of the failures of the U.S. math education enterprise, not the inadvisability of teaching algebra.  The U.S. math education establishment decided, with no empirical evidence, to switch math education to a "discovery" approach roughly 15-20 years ago.  It has been a complete failure, with many schools now switching back to the direct instruction approach used by the nations best in teaching math.  Seattle is a prime example of the failure mode, with poor math curricula at all levels.  We need teachers who have deep knowledge of the math topics they teach, which is often not true in elementary and sometimes middle school.  In short, we need to fix the basics.   But the basics seems to be ignored by many districts and education boosters (like the Seattle Times, Wa League of Education Voters, Gates Foundation) who push quick-fix panaceas (charter schools, Teach for America, restricting teacher flexibility, etc.) that don't deal with the real problems.  Other major culprits are the education schools, who push trendy, theoretical approaches rather than making sure new teachers know their subjects and effective approaches to teaching.  


If students aren't learning algebra well, you can drop the subject--as Hacker suggests-- or learn how to teach it better...which would you prefer?


Heat Waves and the Thermal Trough

| comments

After a number of days with below-normal maximum temperatures, the Northwest is going to warm up for an extended stretch.  Several days in the 80s and even some hope of hitting 90F in portions of the west.  No, you are not dreaming.

But anyone wanting to be informed about northwest warm spells has to master the key feature of our warm periods:  the thermal trough.  I am very interested in thermal troughs...in fact, with support from the USDA Forest Service my student Matt Brewer and I have a research project on this topic.

If you look at a climatological pressure chart for the summer, it looks something like this.  High pressure over the Pacific Ocean and lower pressure over the HOT southwest deserts and Mexico. Hot air is less dense than warm air and this results in less pressure at the surface.  Yes, many of you think of low pressure being associated with cold, cloudy weather, but believe it or not, areas of very warm temperatures can be associated with low pressure as well.  Sometimes we call these features heat lows or troughs.
 In this kind of pattern, the coastal portions of the NW stay cool...higher pressure offshore and lower pressure inland forces onshore flow, and the ocean is cold.  Sorry, that is the way it is.  Natural air conditioning.

But sometimes..like this weekend...a miracle happens.  A lobe of high pressure extends inland of us, forcing offshore flow.   This offshore (easterly) flow starts over the heated interior of the continent and then gets even warmer when it sinks down the western slopes of the Cascades.   The result is that a tongue of warm air extends northwestward out of the southwest--generally northward from the interior valley of CA or the intermountain West---towards our region.   Each day it moves farther northward and strengthens.  And since warm air is less dense, a pressure trough (area of low pressure) extends northward with the warm air.  Want to see an example?  Here is one from a paper Matt and I have written (you can see the pressure lines and temperature--shading).
Now we call this feature a thermal trough, but we really should term it a thermally induced trough, but that would have a little too racy an acronym for conservative meteorological journals.

A thermal trough is about to develop over western Oregon and Washington.  Let me show you with the latest simulation.  Each figure will present sea level pressure (solid lines), surface winds, and lower atmosphere temperature (shading).

Today at 5 PM...the normal situation.

 Tomorrow at 11 AM.  High pressure building inland.  Easterly flow over Oregon...a thermal trough is starting!

 Saturday morning at 5 AM.  A nice thermal trough in western Oregon and its moving into western Washington.

Saturday at 5 PM.  WOW.  Huge, warm thermal trough extending into western Washington.  Heat wave.  Temperatures certainly in the upper 80s away from the water.


Thermal troughs don't last forever.  Eventually the supporting inland high pressure moves eastward and the trough jumps into eastern Washington.  This happens during the day on Sunday:
Don't worry, Sunday should be plenty warm--in fact, I expect it to be the warmest day...typically the day the trough moves across the mountains is the warmest day of the sequence.  Could well have lower 90s from Seattle southward.   Here is a model surface temperature  forecast map for 5 PM on Sunday. Close to 100F in southeast WA and of course Portland and the Willamette...isolated from the water...are much warmer than Seattle.  Water greatly moderates the temps over NW WA and the coast.


Thermal troughs not only bring warmth.  Often the heat results in poor air quality (high ozone), and thermal trough passage over the mountains can really rev up any wildfires that are smoldering.    Thermal trough passage causes big wind shifts that can play havoc with wind energy predictions.    You can see why we are studying these troughs...they are important for a number of reasons!

And to really warm your hearts, here is the latest 8-14 day forecast by the Climate Prediction Center.  Above normal over much of the west...except for the WA coast.

Climatologically, this is the warmest, driest time of the year...there is a reason SeaFair is this weekend.

Boring Weather

| comments

The media loves to highlight extreme and exciting weather, but they have missed a critical opportunity:  to describe perhaps the most important extreme of all-- extremely boring weather.

Where in the U.S. are folks experiencing the same, dull weather, day after day?  How dull can it get?

You won't find coverage of this topic on CNN or your local news channel, but this blog pushes the envelope on such important matters.


The first stop in our boring weather tour will be Los Angeles, where the high temperature of the PAST SEVEN DAYS has been either 70 or 71F!  And the peak winds have have hardly varied in speed and direction.  Dullsville.


Or San Diego the last week.  A real snooze, with highs of 72 or 73F each day, no rain, no nothing.


But if there was an Olympics of weather boredom, we need to look closer to home, where the gold medal of weather uneventfulness goes to North Bend, Oregon, where the average temperatures over the PAST MONTH have ranged from 58 to 62F, and the max temps from 63-68F.


This is pretty bad....but surely the forecast suggests some excitement for the good folks of North Bend!  Here is the latest prediction from the Weather Channel.  Yikes!  The highs range from 62 to 66, partly cloudy every day, with a 10-20% chance of drizzle!


You ask why is the weather so BORING over the West Coast during summer?

The answer is clear...we have a cool Pacific Ocean offshore that doesn't change temperature much.  Onshore flow of marine air at low levels.  The jet stream and weather disturbances are far to the north.  High pressure offshore and few thunderstorms.  A deadly period of meteorologists...

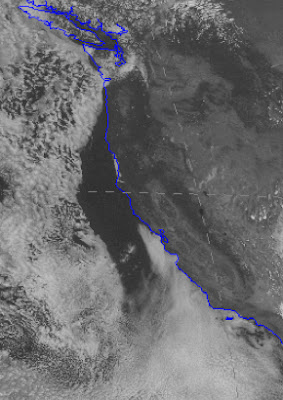
Boring satellite image...some low clouds over western WA (surprise!) and along the central and southern CA coast (another big surprise).  Sunny in eastern WA and the interior of CA (more surprises).  Low clouds offshore.


Support : Creating Website | Johny Template | Mas Template
Copyright © 2011. The Weather - All Rights Reserved
Template Created by Creating Website Published by Mas Template
Proudly powered by Blogger