The End of NW Drought

| comments

The second half of summer has been really dry over the Northwest.  Take a look at the plot of actual versus normal precipitation at Spokane and Sea-Tac Airport for the last 12 weeks: we have had little rain the last month and are down 1-2 inches for the period compared to normal.  Not a serious issue since we are usually dry this time of the year.  And it is going to change!


Here is the lastest infrared satellite picture (Sat morning).  There is considerable cloudiness over us right now from a weak frontal disturbance and even some light showers are occurring), but the main action will be Sunday AM as a strong system reaches western WA. Let me remind you that the whiter the pixel in an infrared image the cooler and thus higher the clouds.


Here is the forecast 24 hr precipitation ending 5 PM on Sunday.  Pretty impressive precipitation after our drought...with .5 to 1 inches forecast over the mountains and windward slopes, and several tenths of an inch over portions of the lowlands.  Even eastern WA gets some scattered precipitation, a fact that is of importance to agricultural interests there.   Want to be dry?...go south of Portland or head to eastern Oregon.


There has been some talk about snow in the mountains, but until you are hiking about 7000 ft I don't think you have to worry about that...but it WILL be wet and windy.  In fact, the winds will also pick up noticeably over the lowlands as well.

Several of you have asked for the latest situation regarding the coastal radar.  The unit is now down for a retrofit for the new dual-polarization option--an enhancement that every NWS radar in the country will receive during the next year.  It is hoped that the radar will come back on line during the next week and the data should be flowing for public use soon after that.  A dedication is planned for later this month at the radar site.   But the radar will still be missing a critical option...the zero degree elevation angle...which will allow the radar to see much farther and better, particularly at lower levels.  Our radar will be the first in the nation to have this option and the NWS promises it will be operational by Nov 1.

Finally, any of you living in Seattle please take a look at the picture and info to the right regarding my lost dog. We took her to local dog sitter who lost the dog over NW Seattle...so keep your eyes out and let me know if you see her.  Thanks.

Reminder:  I am teaching atmospheric sciences 101--Weather--this fall at the UW if anyone is interested in taking it.  Retired folks can do it through the Access program (something like $5) and others can take the course as a non-matriculated student (but they do charge)

Resolution

| comments

 Numerical weather prediction models are generally solved on a three-dimensional grid, with the distance between the points--the grid spacing-- a measure of the resolution of the model.

We often talk about the horizontal resolution of a weather forecasting model ... the horizontal distance between the grid points.   This resolution has greatly improved over the years as greater computer power has become available--from roughly 600 km in the earlier 50s to 12 to 4 km resolution today.

Let me shown you the implications of resolution using the WRF model used at the UW.

Here is 36-km resolution--representative of the best we had roughly in the late 1990s--for surface air temperature.
Really just the major features:  no hint of valleys, Puget Sound is not apparent. No volcanic peaks.

Here is 12-km, the main resolution run by the National Weather Service today.  A bit better, with more definition.  No Puget Sound really.


 Next 4-km.  Far more structure and the valleys are much better defined.


 And finally, the best--4/3 km.  Run here at the UW  for Washington and nearby states, the detail is extraordinary.  Much of Puget Sound is defined.  Individual river drainages are clearly resolved.  You need this resolution to get realistic flow in the Columbia Gorge.


Mount Rainier and other volcanic peaks are clearly evident.  In five years or so such resolution will be operational throughout the nation.  This image is really beautiful too....you could hang it on the wall as art.

Right now the National Weather Service runs a global model at roughly 25-km resolution, and regionally at 4-km grid spacing. To be able to explicitly simulate thunderstorms one needs to do better than 4-km resolution, with more being better.

In the vertical, the resolution is dependent on the number of layers we have.   For our local WRF model we used 37, with more layers near the surface where we really need the detail.

It takes a lot more computer power to make even modest improvements in resolution--every time you double horizontal resolution you need roughly 8 times more computer power.   It is not surprising that weather forecasting uses some of the most powerful computers in the world.

Here in the Pacific Northwest we run 36, 12, 4 and 4/3 km resolution forecasts twice a day on clusters of commodity-off the shelf--processors (Intel Nehalem cores).   This activity is sponsored by the Northwest Modeling Consortium, a group of Federal, State, and Local Agencies and some private sector firms.  

When is a record not really a record?

| comments

Today the Seattle Times has an article noting that Seattle (Seattle Tacoma Airport) has beat the all-time record for the number of consecutive days of 80F and higher in September.  Today (Monday) should be much cooler since marine air has pushed into western Washington overnight, with low clouds extending to the Cascades.  The heat wave is over.

Here is the plot of the temperatures the last few days.
You will note that on two of the days the temperatures only got to 82F.   Now here is the question.  As I documented in an earlier blog (click here to see it), the third runway has clearly warmed up the temperature sensor at Seattle by roughly 2F.      On the two days SeaTac reached 82 of the now 9 day streak above 80 the neighborhood surrounding SeaTac had highs of 78 and 79, averaged over 4 schools.  That leaves the obvious question:  would Seattle have reached this record if the third runway was not built?  We cannot be sure.

As I have discussed in this blog a number of times, the implications of human-emitted greenhouse gases are profound and substantial warming is pretty much inevitable.  But there IS an issue of our temperature sensors being in places in which development has occurred, as well as sensors that are simply poorly placed.  I don't think we have a clear understanding of the impact of these sensor problems, even though some research has been done on it.

Just to show you the problem, here are pictures of the temperature sensors at three official climatological observing stations in Washington State.  Remember sensors should be over natural vegetated surfaces, away from buildings and concrete/asphalt, and not near heat sources.

Here is Wilbur, Washington.   Breaks every rule....even near the exhaust of an AC unit!  (The temperature unit looks like a set of stacked plates---that is the temperature enclosure)


 Or Dayton, Washington.  Being above gravel is a no-no, and it is close to a building and concrete.

Or Conconully, Washington.  Above rocks and concrete steps.


The problem folks is I could show you dozens more of these for the Northwest and hundreds for the U.S.  Poor siting, not above natural vegetation, too close to buildings, and more.  And it gets worse---there is development/urbanization going in the neighborhoods of many sensors.  Some of the worse problems are at rural sites, so studies that have tried to determine the "true" temperature signal by separating rural from urban sites have often been flawed.

We have a problem.   The U.S. is now establishing a set of primo instruments in virgin locations, but that doesn't help much in documenting past trends.  TThere is little doubt that some records have been influenced by these siting issues.

Now for those global warming skeptics who are smirking about all this, let us make it clear--poor siting does not mean global warming induced by humans is nonsense.  It means we have to be more careful in separating out sensor issues from the real signal.  The real signal is going to get a lot larger,

Finally, any of you living in North Seattle, please keep your eyes out for my lost dog:  more information here

Smoke Signals and Lost Dog

| comments

Before I deal with the main blog topic, I would like to ask those of you in North Seattle to be on the look out for a lost black/while cockapoo:   information is here.  Thanks for any help.

During warm days there is a profound change in winds up and down the Olympics that is normally invisible, but become apparent when there is a wildfire on the Olympic slopes.

Dale Ireland has a wonderful permanent cam facing the Olympics and has been recording the smoke from the Big Hump fire the last few days.

Here is a video for a few days ago:  http://www.drdale.com/lapse/lapse110906s.mov

This one is also good: http://www.drdale.com/lapse/lapse110903s.mov 

During the day, as the slopes are heated there is upslope flow moving towards higher elevations--this upslope flow and the destabilization of the atmosphere as the mountains heat up produces convection and enhanced upward flow.   Sometimes this convection is accompanied by a cumulus cloud as well as smoke (called pyrocumulus).   The rising air cools due to the expansion of the upward-moving air and eventually the initially warm air is no longer buoyant (becomes the same temperature as the environmental air at that level) and no longer rises.  You see this all the time from smoke from smokestacks hitting a level through which it can pass and then spreads mainly horizontally--check out this picture:


During the evening, the surface of the mountains cools as the infrared radiation loss to space exceeds the incoming energy from the sun.  The daytime convective/smoke plume dies (since it depends on the surface being sufficiently warmer than the air above), and air starts moving down the mountain....known as downslope flow.  The smoke is entrained in this  flow and heads down the slope.  That is what you are seeing.

Latest on La Nina

| comments

A number of you have asked about La Nina and the upcoming winter.  It is always prudent to wait until mid-September before making the call, a call that in any case has considerable uncertainty.  The U.S. Climate Prediction Center has just upgraded the status from a La Nina Watch to a La Nina Advisory--they are basically committing to a forecast of a La Nina winter.  It is not unusual for two La Nina years to occur in a row, although the second one is generally weaker.

I don't have to tell you the implications of La Nina for the Northwest--AFTER January 1 it is generally associated with cooler/wetter conditions that produce more snowpack than normal in the mountains and a higher probability of lowland snow.   So local departments of transportation should stock up on road deicer!

So what are some of the signs of an upcoming La Nina?  First and foremost, colder than normal sea surface temperatures (SST) in the tropical Pacific.    Here are the SST anomalies (differences from normal) for the last year.  Take a particular look at the Nino 3.4 values.  The cold anomalies have increased.

We have also seen that cold anomalies have increased substantially BELOW the surface...here is the proof:
And the wind field (stronger trade winds) have not abated since the last La Nina.

Until recently, the NWS was undecided whether the coming winter would be a neutral (La Nada!) year (when tropical SSTs are near normal) or a La Nina year.   The trends now point to the latter, although there is still some uncertainty.   The latest computer predictions (see graphic below) are mixed between La Nina and Neutral, although the NWS coupled forecast model (which is a coupled ocean-atmosphere prediction system that is run out for months) is going for La Nina--and this model has been skillful lately.
One thing for sure...it does not look like an El Nino year! 

And here is the latest winter predictions from the Climatic Prediction Center:


Wetter and colder for us, warmer and drier for the SE.  Does this look familar?

So it might be a good winter to get that annual ski pass.  Probably lots of snowpack for next summer's water supply.  And local global warming skeptics will make the usual remarks.

Large Diurnal Temperature Range

| comments

An interesting aspect of the current weather regime is the large diurnal (daily) temperature range--the difference in temperature between the daily highs and lows.  At a number of Northwest locations we have seen highs in the 80s and 90s, while temperature have plummeted at night into the lower 50s and even some 40s, with some dropping into the 30s.   I am talking about surface air temperatures here, measured at roughly 2 meters. Some good examples:

Baker, Oregon--high of 90 and a low of 39F:  a diurnal range of 51F!
Olympia,WA--high of 85 and low of 44:  range of 41F

Or consider the Turnbull climate reference network site near Spokane that had  a 51 deg temperature range today with a low of  36 and a high of 87 on Tuesday.  What is really amazing is the range of surface (ground) temperature that on Tuesday jumped from 32 F to 114 F (82F!!) on Tuesday.  You read that right....from frost on the ground to 114F in one day.   That will crack some rocks!

 Here are graphs of temperature for the last two weeks--all of which show the huge range.  First, Sea-Tac, then Pasco, and finally Spokane.  All have a much greater range than normal.
So why such a big range?  Hint:  we often observe such big daily swings during late summer and early fall.

We start with fairly warm aloft and the sun being still fairly strong....that allows warming.
We have weak offshore flow aloft...that keeps the low clouds and marine influence at bay.
We have clear or nearly clear skies...that allows good infrared radiational cooling to space--and thus good temperature falls at night.
And nights are getting longer--that gives more time for nighttime cooling.  And the relatively equal time for heating and cooling at this time of the year is helpful

Put this all together and you get one big temperature range.  During the winter the range is far less in general, particularly because the cloud cover reduces heating during the day and infrared cooling at night.


Now for the controversial part of this blog.   There seems to be some difference in opinion whether a large temperature range is good for viniculture.   Does a big range help or hurt the quality of grapes used in wine-making?  Some online sources claim that such a range is good since it has the effect of producing high acid and high sugar content as the grapes' exposure to sunlight increases the ripening qualities while the sudden drop in temperature at night preserves the balance of natural acids in the grape.  Others, like the book by Gladstone, claims that a narrow temperature range is good.  Any wine experts read this blog?  What is the correct story?  I have always found the meteorology of wine making fascinating...and will climate change make eastern Washington wines even better?  Perhaps in another blog.

What is the warmest place on Earth? Warmest in the Northwest?

| comments

Perennially chilled Pacific Northwest folks are naturally interested in warmth and so I thought I might share some results of very interesting article in the Bulletin of the American Meteorological Society, which attempts to find the hottest place on earth and here in the NW.  (Article is by David J. Mildrexler, Maosheng Zhao, and Steven W. Running of the University of Montana)

Do a search on the warmest place on earth and you typically get El Azizia, Libya with a record air temperature (at 2 meters) of 136F measured in 1922.  Furnace Creek in Death Valley National Park comes close 134.1F.  But there is another way to measure temperature--- determining the temperature of the ground (the skin temperature) from space.  We can do this by measuring the amount of radiation emitted by the ground (sort of like a super ear thermometer that uses similar technology)  Now this satellite approach has the advantage that it measures the temperatures everywhere and there is a good chance there is no observation at the hottest locations (who would want to live or work there!).  On the negative side, this is not air temperature, which is generally less than skin temperature on hot, sunny days--sometimes a LOT less.

Anyway, these folks at U. of Montana used data from 2003-2009 from the MODIS satellite, which has a resolution of roughly 6 km (so it is probably missing the absolutely hottest points).

Ok, get your icy drink ready...here is the answer.  This graphic shows you the results.  The warmest location seems to be in the Lutt desert of Iran.  The second graphic shows you a blow up of the temperatures and an image of that desert.  Looks like hell.  It is like hell.


Several places come very close....but Lutt is the winner.

But what about the Pacific Northwest--where is the warmest ground to be found (I suspect there is going to be a stampede there in a few weeks)?  Here is the graphic. The left shows the temperatures and the right the land use (click on image to expand)..


Looks to me that the warmest location is on the Hanford reservation where there is no irrigated fields.  Such fields have a large impact on temperature, something you can see by comparing the temperature map (blown up version below), with a google maps satellite image (also shown).  Evaporation off irrigated fields can cool temperatures down several degrees (F).


No jokes about warming from the radiation at the Hanford facility...this is not the cause.  And there are a few warm locations just south of the state boundary as well.  Anyway, another reason to head to the Tri-cities during the spring and fall when it gets cool on the west side.  But don't try this during winter!---the lowest elevations of eastern Washington are cool and cloudy in midwinter, as cold, moist air settles into the terrain bowl in that area.

Wildfire Season

| comments

Due to the high snowpack from our La Nina winter and cools condition extending into July, wildfire season has been delayed over the Northwest; however, recently there has been a significant increase in fire activity, reflecting drier than normal conditions during the past month and belated warming over our region.  And you haven't seen anything yet.

Here is the latest Forest Service map of fire incidents over the region--all of the them are east of the Cascade crest, mainly in Oregon.

You can see several of the fires on today's MODIS satellite imagery (click to enlarge--necessary to see the smaller fires):


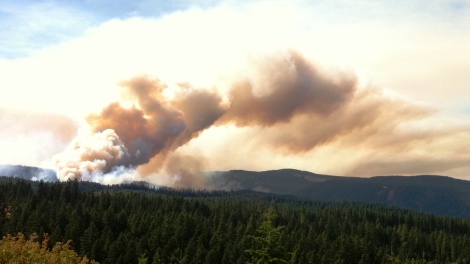
The most prominent smoke plume is not from the largest fire-- the High Cascades fire, which is now encompassing over 100,000 acres near Madras, Oregon--but from the Dollar Lake fire, 16 miles south of Hood River (roughly 3000 acres).  The winds are clearly from the east and you can see the smoke plume moving WNW towards Portland. If you look carefully you can see the smoke from a small fire over the Olympics.

Here is a nice shot of the smoke from north of the Gorge looking south and another near Mt. Hood.


Both of these fires were initiated by lightning strikes.

The local wildfire problem is probably going to get much worse during the middle and end of next week.  No rain is in sight and after a minor cooling on Monday and Tuesday, the heat should really rev up mid-week as the ridge over the western U.S. greatly amplifies into a huge atmospheric blocking pattern.  Here is a sample forecast for next Wednesday...wow.  And there is no end in sight.


 West of the Cascades we should see the entire region (away from the water) moving into the mid-80s, with a number of daily high temperature records falling.

A major concern is that the burnable surface materials ("the fuels") are drying out rapidly.  Here is a Forest Service figure showing you the moisture content of the "1000-hr" fuels---the bigger, thicker branches and debris. Darker red indicate seriously dry fuels and this is only going to get worse.
 A key feature in predicting fires is the thermal tough--a region of low pressure associated with warm air (I blogged about such features last week).   Right now I am doing an intensive study of West Coast thermal troughs with support from the U.S. Forest Service--understanding their generation and movement.  Thermal troughs are associated with a deep, warm air mass that is relatively unstable and enhanced fire danger occurs as such troughs move across the Cascades, with strong winds and upward motion right behind. During the middle of this week an amazing thermal trough is predicted by our high-resolution models.  Want to see?  Here is the predicted sea level pressure and temperature at roughly 2500 ft:


 In short, we are going into one of the warmest September periods we have experienced in a long time and fire danger is getting serious.  The only good thing is that there won't be much lightning. 

Upcoming Warmth

| comments

During the past few weeks we have had really decent weather--generally dry, with periods of above and below normal temperatures.

Such variability, centered around climatological temperatures, is what normal is all about.
There has been enough sun and warmth for a miracle to happen---I actually have red, ripe tomatoes!  Few pleasures in life are greater.  Here is the proof:


Well, another miracle is occurring...we are going into a warm up period through the weekend and then the heat really revs up on Tuesday and Wednesday as a monster ridge builds up over the western U.S.  And it just stays in place forever.

Right now a weak trough is moving through, bringing increased cloudiness over the region.  Tomorrow (Friday) we should wake up to clouds, but they should break up during the afternoon...low to mid 70s.   But on Saturday ridging aloft develops (see upper level chart) and the temps warm with more sun.  Perhaps a bit warmer on Sunday.
But early in the week ridging really develops (graphic) and temperatures could hit the mid 80s.
And do you see that features in the lower right...another hurricane.  The NWS GFS model has this storm approaching the East Coast late Friday (see forecast for Friday AM below) but the forecast will surely change.  The latest solution gets the hurricane/tropical storm close before it swings to the NE off of New England.


The NWS Climate Prediction Center is suggesting increased probabilities for above normal temperatures through next week. (see graphic).

No fried green tomatoes for me!

Just a reminder...will be starting my KPLU weather segment tomorrow (Friday) at 9 AM...right after birdnote.


NW Fog Season and Media Fog on Fox News

| comments

Well, if hurricanes are on one side of the meteorological spectrum, what is on the other?


Recent fog picture courtesy of the Seattle Times
You guessed it...fog, and folks the Northwest is entering fog season.  In fact, September and October are the foggiest time of the year around here, NOT the middle of the winter.

On Sunday I got to experience fog first hand--I was heading to Bellingham to do some kayaking near Lummi Island (Elakah kayak).  Seattle was densely fogged in, but every time we gained a few hundred feet elevation on I5 we escaped the shallow fog. This was quite shallow stuff...a few hundred feet at most.  On the water near Lummi we were in dense fog until it lifted around noon.  Here is the visible satellite picture before it burned off. 
One thing we have learned from satellite imagery is that fog burns in from the sides.

The irony is that REALLY dense fog, like on Sunday, is generally a good indicator of clearing later in the morning.

So why is the fall our big fog season?  The nights are getting long...that certainly helps, allowing more time for the air to cool to saturation (the dew point).  Relatively clear skies, since the storm season has not arrived yet.  Clear skies allows infrared radiation loss to space from the earth...giving us the needed cooling.  The atmosphere is relatively stable this time of the year, since the air aloft is relatively warm compared to the surface at night.  Warm air above cool, dense air is stable, and fog loves stability.

The least foggy time of the year here?  Spring!

And now a few comments and announcements.

First, the award for the absolutely dumbest opinion piece I have read in a long time--goes to foxnews.com for suggesting that the National Weather Service is unnecessary and should be sold off.  Here it is:
http://www.foxnews.com/opinion/2011/08/27/do-really-need-national-weather-service/

A sample of this foolish piece:  why do we need the National Weather Service when we can get our forecasts from the Weather Channel?   Folks, who do you think gathers all the observations and runs all the computer models?  Where do you think the Weather Channel gets this information from?  I could list a dozen more, but you get the idea.  We are talking completely brain dead.  How could Fox News publish such trash?

Second announcement: just a reminder I will start my new weather program on KPLU-FM at 9 AM this Friday.  And I plan to talk about hurricanes...OUR HURRICANES.  You can listen on the web, at 88.5 in the Puget Sound area, and additional frequencies at other locations (check their web site for the repeater stations--link to the right).

When Did Irene Stop Being a Hurricane?

| comments

On Sunday morning Anderson Cooper of CNN was asking about the strong winds that were being forecast and this brings up something that has really bothered me about the storm:  there is really no reliable evidence of hurricane-force winds at any time the storm was over North Carolina or moving up the East Coast.

First, what is a hurricane?  The official definition is that a hurricane is a tropical cyclone with SUSTAINED winds of 64 kt or more  (74 mph or more).  A gust of 65 kt  or more does not indicate a hurricane unless the sustained winds reach 64 kt.

I took a look at all the observations over Virgina, Maryland, Delaware, New Jersey, and New York.  Not one National Weather Service or FAA observation location, not one buoy observations, none reach the requisite wind speed.  Most were not even close.

Surely, one of the observations upwind of landfall, over Cape Hatteras or one of the other barrier island locations, indicated hurricane-force sustained winds?  Amazingly, the answer is still no.


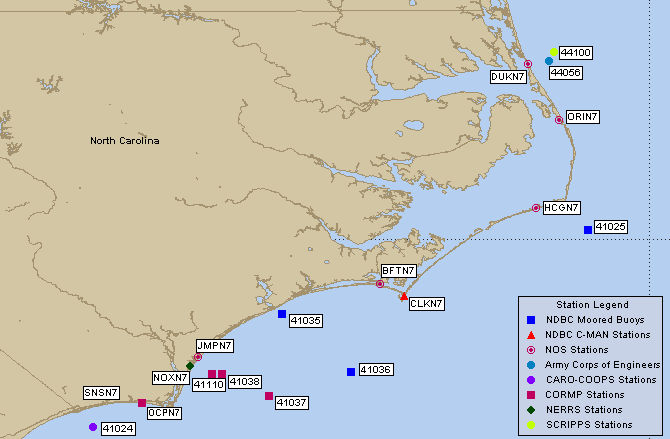
Here is a map for reference.  The strongest winds I could find was at Cape Hatteras (CLKN7) where the winds got to 59 kt.


Or buoy 36, south of Cape Hatteras over the water...only got to 49 kt there.


Or plot the winds when the storm was just making landfall...no sustained winds even close (see graphic).  Solid triangle is 50 knots, big line is 10 kts, small line is 5 kts.  Look for a triangle, solid line and small line (65 kt), or more....none exist.


Yes, there were a handful of hurricane-force wind reports but none of them were from official stations and there is considerable doubt about their reliability.  Furthermore, satellite imagery clearly showed a poorly formed storm off of North Carolina--with little evidence of an eye.

The truth is that there was little chance of intensification of the system as it moved up the East Coast.   Storms derive their energy from warm ocean water and the second the storm made landfall half of the storm was over land--which saps the strength of the system.  The other half was over increasingly cool water.  This system was toast.   But as a tropical storm weakens and "goes extratropical" there is a tendency for the precipitation to swing to the W an NW of the storm.  That is exactly what happened .  The big threat was flooding, not winds.

I assume that upon further study the NWS will eventually downgrade this storm as it moved up the East Coast.  Considering the tendency for media to hype storms it it crucial for meteorologists to stick to the exact story and not overwarn in the hope of encouraging people to take effective action.  If the storm was known NOT to be a hurricane earlier might the Mayor of NY have held off closing the City down, thus saving billions of dollars?

Hurricane Irene Forecasts and Their Hurricanes Versus Our Hurricanes

| comments

The media is hitting Hurricane Irene really hard and some descriptions are going too far: "historical storm", "storm of the century", etc.  Folks, this a category 1 storm with sustained winds of 85 mph.  Serious, but not catastrophic.  We are already seeing local authorities overreact--like NYC cutting off bus and subway service at noon EDT.  At that time the winds at NY's Kennedy Airport were 8 miles per hour and there are only a few showers around.   The strong stuff will not happen until tonight, so why cripple people's ability to move around and for coastal people to evacuate?  Overreaction stemming from massive complaints about poor snow removal last winter?

A key reason for my field to improve forecasts is to reduce the overwarnings and overreactions--which undermine confidence in forecasts, resulting in calls of "crying wolf" and lessening public reaction when truly threatening situations are imminent.    Many of us worry about situations such as the SE tornadoes when forecasts are very good, but many people still die.  And more limited and surgical warning save money.  Big money.  The trouble, of course, is that the media loves to overhype storms...really good for viewership.

For those of us on the West Coast it is good to keep some perspective on storms.  We don't have tropical hurricanes, but our big storms are the equal of all but the strongest hurricanes. Take Irene..fairly large hurricane with sustained winds of 85 mph and a central pressure of 952 hPa (mb).  Here is a nice image of it:


Lets compare to our Dec 12, 1995 windstorm.  Here is an image:


Ours is just as big if not bigger.   Maximum winds?  Here is a nice analysis by storm-maven Wolf Read:

Gust to well over 100 mph on the coast!  Certainly, the winds from this storm are in the same league or greater than Irene.  Central pressure of our storm--953 hPa...virtually the same as Irene.  The 1995 storm is nothing compared to the 1962 Columbus Day Storm.
And the waves from our big storms generally eclipse those of the East Coast varieties.

A major difference between our storms and East Coast hurricanes is the coverage--for many reasons the WeatherChannel and East Coast media give relatively short shrift to our storms. 

But hurricanes do bring heavy rains and flooding, which is generally limited for our big windstorms.  The reason--hurricanes are tropical systems depending on warm water and the release of heat by condensation of water vapor.  Our storms derive their energies mainly from another source:  horizontal variations in temperature.  And the coastal areas of the east coast are more vulnerable to storm surges and coastal flooding--the biggest threats of hurricanes.


Support : Creating Website | Johny Template | Mas Template
Copyright © 2011. The Weather - All Rights Reserved
Template Created by Creating Website Published by Mas Template
Proudly powered by Blogger