Mid-Level Convection

| comments

Yesterday was quite a meteorological treat, with interesting clouds and an amazingly colorful sunset.   But it was also a good example of mid-level instability--when the mid-levels of the atmosphere starts to break out into cumulus-like convective features.

Yesterday, a weak upper level disturbance was approaching, with upward motion aloft, producing an unstable layer  above the surface.

One sign of the upward motion was the development of cirrus, include some impressive fallstreaks (made of ice crystals).  Several of you sent me pictures you took of this beautiful feature and several others were shown on the web (see example below from George Tanaka of Bainbridge Island--courtesy of Scott Sistek's blog):


The curved ice crystal "tails" falling from the cirrus are often called "mare's tails."  Why are they curved?  The reason is that the wind speed change with height--usually decreasing below the main body of the cirrus--thus the curve.

But as the day progressed the air at mid-levels started to convect into small cumulus, actually altocumulus.  Some of these cumuli developed tower or turret shaped features--they are known as altocumulus castellanus.  Now that is name that will impress your friends!  Just say that casually at some party and it will turn some heads.

Here is a great video from the UW web cam that shows the destabilization of the mid-levels and the development of the convection, with some of it deep enough that rain started to fall out:


Click for video
http://www.atmos.washington.edu/images/webcam0/movies/20110824.mov

And you can catch the marvelous sunset.The instability clouds were apparent on the satellite pictures during the afternoon and afternoon:

An offshore band was particular impressive.

And an added features---Mt. Rainier developed a nice "cap" during the afternoon...a sign of moisture and lift aloft.

It is now clear that Hurricane Irene is going to savage the East Coast--a really serious storm. But for us, just the opposite.  The warm, perfect weather will continue through Sunday, with perhaps a slight cooling on Saturday.

And a reminder---I will be teaching Atmospheric Sciences 101 this fall if anyone is interested.  UW students, of course, and others who want to take it as non-matriculated students.  Retired folks can get in for practically nothing.

A Potential Breakthrough in Hurricane Forecasting

| comments

If you are a billionaire, a foundation leader, a powerful politician, or have a few million dollars to spare, I have an idea for you, one that might greatly improve the skill of hurricane forecasts.   No pressure--just a chance to make a huge difference in predicting storms that do billions of dollars of damage a year. But first lets talk hurricanes.

Today, Hurricane Irene is heading for the southeast coast of the U.S., and the current predictions of the National Hurricane Center suggest that the storm will make landfall either on the Outer Banks of  North Carolina or New England (or both).  The graphic below shows the NWS track forecast.  You notice they use a cone shape that increases in width in time, consistent with the loss of track accuracy in time.


 For three years the U.S. mainland has been spared a direct hit and we have become complacent.  When I was back in D.C. for a meeting at the NWS National Centers for Environmental Prediction there was lots of talk about massive cuts to the hurricane research budget.

Perhaps, things are about to change.

The interesting thing about hurricane forecasts is that we have gotten much better in some ways (predicting the track of the storm) and have barely improved in others (forecasting the intensity of the storm).

Want to see some sobering figures?  Here are the changes of errors over the past several decades for hurricane track and intensity.  A steady and impressive improvement in track forecasts.  For 48h forecasts the errors have gone from 300 nautical miles in 1970 to 80 nm today.  Huge improvement. But intensity forecasts have hardly changed--even gotten worse at 24h.


We understand why this discrepancy occurs.  During the past decades we have gotten much more observational data AROUND hurricanes from satellites and other sources and our numerical models have gotten better.  If you have a better handle on the environment of hurricanes you can secure a much better prediction of their track, because they are steered by the larger scale flow.   But to predict changes in their intensity, you have to know the details of their innards; you have to be able to specify their internal structure and have computer models with the very high resolution needed to get the fine-scale structure (eye wall, rainbands) correct.   Historically we have had neither.  Thus, our ability to forecast intensity is poor.

But the situation could be changed for the better.  Today, we have the computer power and models capable of doing the job--we are talking about running our computer models with grid spacings of 1-2 km (today we use 12 km).  Here is an example of what we are capable of--a simulation at 1.3 km grid spacing:
Beautiful simulation of the eye and rainbands. Amazingly realistic.   But we need to get data inside the storms at high resolution: data that can be used to start of initialize our great models.  That is where we need to improve.

One approach is to send manned aircraft, like the NOAA P3, with sophisticated radars and dropsondes (weather instruments that are dropped into hurricanes.)  This is good, but it is very expensive and we can't afford to have enough planes out there at all times to do the job.

A better idea would be to use unmanned aircraft to do the reconnaissance.  Today NOAA and NASA are experimenting with the use of Global Hawk drones that could fly high above hurricanes with downward-looking radars and the ability to release dropsondes into hurricanes.

This is very promising.  But we acutely need observations IN the hurricanes and particularly near the surface where the critical fluxes of heat and moisture are driving the storms.  We need unmanned aircraft that are tough enough to do the job, yet cheap enough that their loss would not be a disaster (Global Hawks cost millions of dollars!).

A local Washington company may have the solution: moderately expensive (tens of thousands of dollars) unmanned aircraft that could get the critical observations.  The company- Aerovel, located in the Columbia Gorge, is led by a brilliant Stanford-trained engineer named Tad McGeer.  He designed another unmanned aircraft that was the first to cross the Atlantic (I know about it, because I was the meteorologist for the mission.  The aircraft, Laima, is now in our Museum of Flight).  Aerovel has developed an aircraft that can take off like a helicopter, transition into level flight, fly thousands of km, return to base and land itself.

Don't believe me?  Check out a video of one of their recent test flights (click on image or link):


Imagine a swarm of these unmanned aircraft densely sampling the lower structures of hurricanes, while the Global Hawks are observing from above.  The information would be sent back in real time to the National Weather Service, where high-resolution models use the information to make highly skillful hurricane predictions...far more skillful than we have today.

A dream?  No.  It is quite possible. But it will take several million dollars to test this out.  That is where we need someone or some group with sufficient resources to provide the seed money that will give this idea a real-life evaluation.


The New Coastal Radar Delivers!

| comments

A major change in weather is now occurring, with marine air pushing into western Washington, displacing the warmth of yesterday.   A front is approaching the coast, but will it rain?  How strong is the front?  Now we know--because of the new coastal radar.

This morning, Brad Colman, Meteorologist in Charge of the National Weather Service Seattle office, kindly sent me this image at 7:17 AM (they are getting the radar in real-time on many days):

 You can see a strong front offshore, stretching to beyond the Oregon border (yellow and red are heavy rain).   Here is an image two hours later (Courtesy of Kirby Cook, Science and Operations Officer, NWS, Seattle):

 This is a very strong front for this time of the year! The reds are heavy rain.  The northern part of the northern WA coast is getting hammered.  At 10 AM, the new radars estimate of precipitation at Quillayute was .64 inches, actual was .60 inches....very good!

Here is the image from the Camano Island radar:

It can't see the front beyond the entrance to the Strait of Juan de Fuca...the parts that will hit Seattle and south--because of blockage of the Olympic and distance.  But the new radar shows clearly the strength of the front extending out over the ocean...marvelous.

Or how about the Portland radar?  If you believed it, you would think that there were only a few sprinkles out there.


The winds are really picking up now, with some places getting sustained winds over 20 kts.  Here is the latest ferry weather winds.  Sustained 25 knots in the central Sound--and gusts would be higher.

The Seattle profiler at Sand Point, which shows winds above the surface, clearly indicates the strong southerly winds that have pushed in aloft....a very different day.  Temperatures aloft have declined by about 10C (18F).


The coastal radar, observations on ferries, the profiler...twenty years ago we didn't have any of them.  And we didn't have high resolution numerical models.   Progress is being made.

This event is associated with an unusually strong summer atmospheric river of moisture.  Let me show you an image of the integrated moisture in the vertical:

See that yellow and red filament heading right towards us?  That is the atmospheric river, and it has our name on it.  Much of the region should see significant rain, particularly those on the SW sides of regional terrain.  Take a look at the 24-h total rainfall predicted by the UW WRF modeling systems for the 24 hours ending 5 AM Tuesday.  1-2 inches on the windward slopes and 2-5 inches on the SW side of Vancouver Island.   This is heavy stuff for August.


The Northwest Drought

| comments


There have been a lot of complaints about our summer weather, but one thing you have to admit--it has NOT been very wet.  Northwest summers are supposed to be relatively dry, but the last 4-weeks have been downright arid around here....even after we got through the climatologically dry period of the last week of July and first week of August.

Here are the precipitation traces for the past four weeks of a line of stations across the State, with the normal shown by the blue lines.


All are way below normal, with virtually no rain the last three weeks.  Sea Tac has had about .15 inches and Spokane nothing.  Week after week of high pressure area parked offshore...pretty boring!  We haven't even seen many thunderstorms over the mountains either.

Want more precipitation...try Phoenix where they had 1 inch during the same period.  You heard that Austin, Texas was in a major drought...well, they had .91 inches during those four weeks.  Surely Las Vegas was drier...but NO...they have had .22 inches-- a lot more than us.

The bottom lines is that we should not be reticent about claiming our title as national drought king during mid-summer.  There is only one area that can give us trouble--southern California.  But who would want to live down there anyway?

The interesting thing is that with all this drought there have been very few wildfires--the recent Tumwater canyon fire near Leavenworth the exception.  Thank the cool spring and massive snowpack. And a lack of thunderstorms.


Strong Sound Breeze and Tragedy

| comments


Last night's 11 PM news and today's Seattle Times related a story about the tragic death of a young man near Seward Park who had been using a Yamaha personal water craft.  The ST article is found here.  In this article there was a brief mention of a sudden increase in wind and choppiness of Lake Washington.

Was there a meteorological origin to this terrible incident?  If so, could it have been predicted?

I think I caught a piece of whatever happened while bicycling home around 6:30 PM from the UW-- not far from NOAA Sand Point I was impressed by the strength of  the head wind out of the north.  It was really strong.  Now on warm sunny days a northerly wind often develops north of Seattle and is called the Sound Breeze.  But this time it came up fast and hard.

Probably the best observation for the boating incident was from the wind sensors at the central part of the Evergreen Floating Bridge.  As shown in the map below  the bridge was upwind of the accident site (X for the incident location and O for the wind sensor).  The winds were from the north so the Evergreen Point wind sensor was in the perfect location.


Here is the wind speed record on the Evergreen Bridge.  Wow.  Around 6 PM there was a very sudden ramp up of wind speed to over 20 mph from roughly 3-5 mph.  That wind, plus a good water fetch north of Seward Park meant rapid growth of waves.

Strong winds also developed down Puget Sound.

The high resolution computer models had a good idea that strong winds would push into the Strait of Juan of Fuca and down into Puget Sound.  Here is a forecast for 8 PM of surface winds from the UW's ultra high resolution model prediction (1.3 km grid spacing!):

Even the UW system did not have enough resolution to handle Lake Washington, which is too narrow to properly resolve.  But it was clear that strong northerlies would hit around dinner time (you can see all these graphics for every hour on my department web site).

But why were the winds so strong and why did they come up so suddenly on Wednesday?  I suspect the answer was the passage of an upper level disturbance that afternoon which really revved up the pressure differences between the coast and inland yesterday. Here is an upper level map showing you the heights of the 500hPa pressure surface at 5 PM--can you see the trough over us?  I think that is the culprit.

So we start with the normal Sound Breeze--essentially a large regional sea breeze.  As the western Washington interior heat up relative to the Pacific and Strait, westerly winds develop in the Strait each afternoon and then push southward into Puget Sound.  But this time the Sound Breeze was supercharged as the passing trough causes an enhanced east-west pressure difference that drove even stronger flow through the Strait and then down into Puget Sound.

My hope is that in a few years we can combine our observations and improved models with modern communications (e.g., smartphones and the like) to allow us to provide highly useful and timely warnings of such events.  We won't stop all such tragedies, but hopefully many injuries and deaths can be avoided.


Bogus Arguments of Some Global Warming "Skeptics"

| comments


During the past week I have gotten several emails from folks who said they had absolute proof that human-induced global warming is nonsense.

The argument they offer:  volcanoes put out way more CO2 than human activities. So it doesn't matter what we do!

Since I have heard this claim at least a dozen times during the past few months, I thought I should just give the facts:  HUMANS EJECT WAY MORE CO2 INTO THE ATMOSPHERE EVEN DURING MAJOR VOLCANO YEARS.

A number of studies have shown that global volcanic activity injects about 0.15 to 0.26 gigatons per year of CO2.  Anthropogenic CO2 emissions produced by mankind provide about 35 gigatons of CO2 in 2010.   Way more.

To put it another way:  current volcanic activity puts out about as much annually as our states of Florida, Michigan, and Ohio.  We have a lot more states and then there is the rest of the world!

The following figure (from a very nice article in EOS by Terry Gerlach of the Cascades Volcanic Observatory in Vancouver, 14 June 2011, volume 92, No. 24, pg 201-202): shows the ratio (the ACM) between human and volcanic CO2 emissions (shown by the dots).  The range of uncertainty (based on the uncertainty in volcanic emissions) is show by the brackets.  What one should conclude is that  human emissions dwarf volcanoes and the ratio is increasing.  Today we put out well OVER A HUNDRED TIMES more than volcanoes.


So please!  Lets move on with this.  Volcanoes today are minor players in the CO2 world compared to us.  

In a future blog I will deal with another argument by the denier set--that human impacts will be dwarfed by the variability of the sun.   As I will show in that blog, this is simply not true either.  I will leave to others to deal with conspiracy theories dealing with Al Gore.

Now don't get me wrong.   Some groups on the "pro" side of global warming are sometimes fast and loose with the facts too, particularly in their claims of C02 induced extreme weather and huge losses of Cascade snowpack.  We can't have a rational discussion of the threat of anthropogenic global warming--and it is a serious threat-- if clearly wrong information is used as bases for arguments.

The Upcoming Week AND What Have We Been Missing?

| comments

I just took a look at the latest model output and it appears that we have a fairly decent week ahead.  In fact, the Climate Prediction Center's 6-10 day forecasts have a different look than we are accustomed to:
Higher odds for warmer than normal in the West (including us), near normal over the middle of the U.S., and cooler in the East.

The persistent West Coast troughing has weakened and we have fairly normal weather for the entire week.  That means dry and temps getting up into the mid-70s.  Just perfect for painting your house (which I just did).

But something has been missing this year.  Something that many of us miss: some good warm spells, with substantially above normal temperatures (like the 80s!! and dare I say it?...the 90s).

Here is the plot of temps versus normal for the last four weeks at Sea Tac:
We got to 80F only twice and never got to 85F.  Most days we  fell short of the normal max.  So why have we been plagued with lack of warm spells?

The answer is that we simply are not getting the right set up--big upper ridge over the west side of the Cascades, surface high pressure to the east, and a thermal trough at low levels moving up the Oregon and Washington coasts.  This is particularly ironic for me, because my student Matt Brewer and I have a project, funded by the U.S. Forest Service to study thermal troughs and to learn how to predict them better.  Thermal troughs are often associated with wildfires.

Want to see what a good thermal trough looks like?  Here is a forecast of one from almost exactly a year ago.  The solid lines are isobars (lines of constant pressure) and the shading denote lower-atmosphere temperatures.  You see the low pressure extending to the WA coast?  Starting over Nevada?  That is it.  And high pressure to the northwest of us over southwestern BC.


We haven't seen such a pattern this year.  Want to see a super thermal trough?  Here is the one with our big heatwave during July 2009:

The low pressure area extended to Vancouver Island!

Thermal troughs, or thermally induces pressure troughs, typically extend up the coast from CA during our heat waves.  They are inevitably associated with offshore flow that keeps the cool marine air away from us.  They are the tail of about a big dog...the dog being large scale high pressure that sets up the offshore flow.

Anyway, lets hope we get a nice thermal trough before the summer is out.  Warm when one wakes up, perfect at night for an outdoor bbq or an evening stroll. 

My Weather Segment is Back on Public Radio! KPLU

| comments

My weekly weather segment on public radio returns on September 2, but on a new public radio station: KPLU.   Specifically, I will be on Fridays at 9 AM for a full five minutes right after the NPR news and KPLU's popular segment Birdnote.   And they will repeat this segment twice in the afternoon during All Things Considered.


Click Icon to go to KPLU's Web Site
But it gets better than that!   I will be talking to Keith Seinfeld, an award-winning science journalist. Keith's been a staff reporter at The Seattle Times and The News Tribune in Tacoma and a freelance writer-producer.   His work has been honored by the American Association for the Advancement of Science (AAAS) and the Knight Science Journalism Fellowships at Massachusetts Institute of Technology.  I am looking forward to an active and interesting conversation with Keith, who plans to prepare carefully before each of our segments.  It makes a real difference talking to someone who is really interested and enthusiastic about a topic.


I will be talking to Keith Seinfeld, KPLU's  well-known science and health reporter
KPLU has good coverage over all of western Washington and, of course, you can hear them live on the web.


What really get me excited is that my segment will be guaranteed a full five minutes, which will always be at the same time.  This is in stark contrast to KUOW, where my weather segment was low priority and positioned at the end of the first hour of Weekday.   Week after week my time would collapse to only a few minutes, pushing me to throw out important material I really cared about.  Many weeks, especially at the end, they ran out of time, moving me to the second hour or cancelling the whole segment.  This was bad for listeners and it won't happen at KPLU.


The KPLU folks are doing even more.  We will be using internet-based calling and our tests have indicated studio quality audio, in contrast to the hard-to-hear telephone audio at KUOW.   And there will be a coordinated web presence, summarizing the special topics we will be discussing.


During major weather events, such as snowstorms and windstorms, I will be providing extra material on KPLU at other times and days.


I have been extraordinarily impressed with KPLU staff and their excitement about presenting not only the weekend forecast, but helping their listeners appreciate the complexity and fascination of our local weather and other weather topics of profound interest (e.g., global warming).  

Change is always hard, but I am convinced that this change is greatly for the better and will be a huge enhancement over what I was able to do at KUOW.   

I hope you will join me at KPLU on Fridays.  You can submit questions through my blog and through a KPLU email address that will be soon announced..  I really value direct interactions with listeners and hope that questions and comments will increase in this new venue.....cliff

PS:  If you are living in Seattle don't forget to vote for the Seattle School Board.   As I noted in a previous blog, we have real chance of turning the district around if we replace the incumbent candidates by some of the excellent individuals that are running:   Peaslee, McLaren, Martin, Buetow, and Whelan will make a difference.  I have talked with each of them and they won't give the administration a pass when things go wrong and will ask questions, compared to the startling incurious current board majority. 

PSS:  A major degradation of the weather on Sunday and first part of Monday as a relatively strong system comes in.  Expect clouds over the west on Sunday and a good chance of showers, particularly later in the day.  But things will greatly improve midweek.

Fears of a Double Dip

| comments

Nothing terrifies Northwesteners more.  

Many of us have suffered greatly because of it. 

Folks are depressed over its effects.  

Supposed experts are not sure which way it will go. 

And the media can't seem to get enough of it, with headlines and articles describing its unpleasant effects all the time.

The nation's financial mess?   Political paralysis in Washington D.C.?

No.....

 I am talking about the threat of...dare I say it?...the return of La Nina next winter.  Or to use a technical term:  a double-dip La Nina.

I know, we suffered from La Nina last winter and this spring, and the forecasts were for an escape to a neutral year.  But the atmosphere is not following the script and the Climate Prediction Center has just put out a La Nina WATCH, which means it is not certain but possible.


So here is the situation.  Last winter we were in a fairly strong La Nina, one that weakened during the spring.   A primary measure of La Ninas (and El Ninos) are the anomalies (differences from climatology) of the sea surface temperatures (SST) in the tropical Pacific. The most well-known index is the SST anomaly in the Nino 3.4 region (see below).  The anomaly weakened to near zero by May, went slightly positive, and now is slightly negative.   Call it Neutral.


The trouble is that although the ocean say neutral the atmosphere has been holding to a La Nina-like configuration...including the troughing and cool weather along the West Coast.  And subsurface temperature sensors in the Pacific indicate cooling.  Ominous. 

The NOAA Climate Prediction Center has a number of models available that simulate the tropical sea surface temperatures.  As shown below, they are all over the place..some near zero, some indicating warming, but an equal number going for cooling.  Looks like a coin flip.
Even more worrisome, the NOAA Coupled Climate Model, their main simulation model for the atmosphere and ocean, is now turning more towards the La Nina (negative) side (see below)


 A look at the history of El Ninos/La Ninas (the ENSO Index) over the past 60 years shows that double dips do occur...such as in 2008/9 and during the mid 70s. (La Ninas correspond to the blue negative excursions).   In fact, double dips are not rare.


So the bottom line:  a double dip, with La Nina coming back is a real possibility, but no sure thing.  By late September, we should have a much better idea, but believe me, we have gotten this wrong plenty of times in the past.

So if I was Mayor McGinn I would kick the tires of those snowplows and be ready to order some more salt if needed.  My group is rushing to complete a powerful new aid for the City, a web-based application called SNOWWATCH. You will not believe what it is capable of!  With the new coastal radar in place, expect better snow forecasts if it does occur.  And KING TV's snowmaven Jim Forman should get his famous parka cleaned--he might need it.

A New Chapter In Pacific Northwest Weather Forecasting

| comments

With all the depressing news these days, some good news is more than welcome.  And I have very good news:  some important Northwest weather history was made last week: the new coastal radar was turned on and we have received some of the first images.  After nearly twenty years of local lobbying for this device, it is now a reality. 

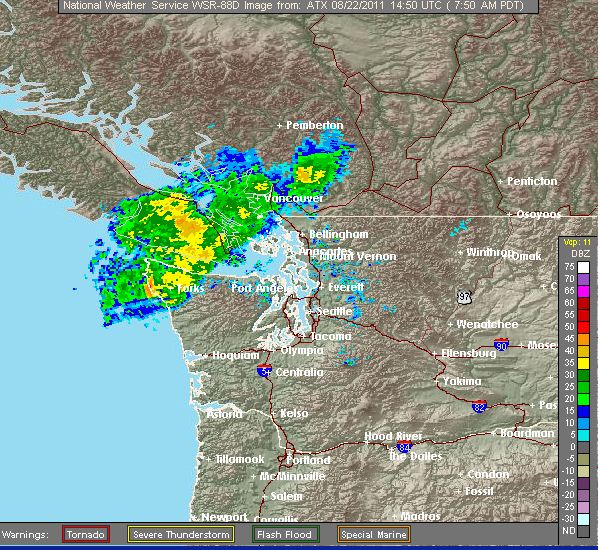
Lets not beat around the bush.  Here is one of the first images from the new Langley Hill radar, showing  conditions around 7:38 AM on Wednesday August 4.  This is from the lowest scan (.5 degree above the horizontal).  The clutter suppression capabilities are not fully operational right now, so you are seeing some returns from the Olympics and the mountains of SW Washington.   But look offshore--the greens and darker blues are from some very light rain over the Pacific.  Can't wait for the first real weather system!   There are some weak returns over the ocean near the coast, that might be reflections off the Pacific, but can't be sure from one image.


Just for comparison, here is what we have now--an image at the same time from the Camano Island radar.  See a difference over the ocean?


The radar will be tested and calibrated over the next month and then will be taken down for two weeks in September to add an important new capability:  dual-polarization.  This will allow the radar to differentiate precipitation types far better and will provide superior precipitation estimates over the mountains.    By the end of the September the radar should be back online and the output available through the web and on the media.

But there is one more upgrade.  This radar will be the first and ONLY National Weather Service radar in the U.S. to scan horizontally---called zero degree elevation angle.  This will allow the radar to see much farther over the ocean and to see better at low levels.  The NWS folks have decided to delay adding this capability until early November to insure it works properly.  At that point, the radar will be complete and ready for the storm season, which hits hard after the first week in November.

As I have mentioned on a number of occasions, Senator Maria Cantwell played a major role (in fact THE major role) in getting the resources for the radar.  Her office has put out a press release with more information today and it can be found here.


And don't forget the web site dedicated to the new radar (found here).  This site is updated regularly.

Weather this week---no major systems.   No major offshore flow/warm-up situations, so don't expect 80s and 90s west of the Cascade crest!  Lots of morning clouds with afternoon burn off.

Yesterday, with cool air over the Sound and warm air above, there were some really good superior mirages, with surface objects looming vertically.  I saw it clearly at Richmond Beach park, north of Seattle.  Greg Johnson of Skunk Bay Weather sent a nice video of it from his location in Hansville:

http://www.skunkbayweather.com/SuperiorMirage080711.html

Aurora!

| comments


There is a significant chance you can see an aurora around here tonight---assuming you can get away from the infernal low clouds.

There was a major solar storm yesterday and the impact is starting to be felt today in the earth's upper atmosphere.   Here is a plot from the NOAA Space Weather Prediction Center (SWPC).


You can see the jump in the proton flux yesterday and if you look at the estimated Kp on the fourth line down (a measure of the disturbance of the earth's magnetic field) we have a fairly major event (estimated Kp values of around 8).  The SWPC has a handy map in which they estimate how far south the aurora will go relative to the Kp number.  Here is is:

The yellow line is for a Kp of 7 and it appears we have that....so the aurora could well be visible tonight if you have a view of the sky.

The NOAA polar orbiting satellite can actually view auroras and here is the latest graphic (2243 UTC, 3:43 PM our time). The reddish color indicates the aurora and the position of solar noon by the red arrow.


Compare this to one day ago.  A big difference.


There are no guarantees in this aurora business, but there is a decent chance you can see an aurora tonight if the sky is clear.   

Major problem for those west of the Cascades...the low clouds.  Here is the latest visible satellite image.  Eastern Washington and above roughly 3000 ft  will be clear.  You simply have to get over the crest.  Possibly ok, at least initially, in the Willamette valley and near Victoria and north of Bellingham.  But the low clouds will deepen and spread again this evening on the west side. 

One of the most magic events of my youth was seeing a major aurora...with the shimmering curtains of color.   I hope many of you can share this...good luck

Do We Need the National Weather Service When There is a Weather Channel?

| comments

Several years ago during a budget hearing, a Congressman supposedly asked why we needed the National Weather Service when lots of forecasts are available on the Weather Channel.  This guy was serious, but misinformed, since much of the material on the Weather Channel--the observations, the model output, the warnings---all came from the National Weather Service.  President Obama  knows--it seems that in nearly every speech when he talks about agencies we dare not cut the National Weather Service is mentioned.

At times I have criticized some National Weather Service policies or forecasts, but let me assure you, their forecasters are experienced and highly trained, and they make substantial sacrifices for all of us (like accepting rotating shifts).   Often TV weathercasters talk about "my forecast" or the "KXXX custom doppler-radar forecast" or whatever, but let me tell you a secret--they look at and rarely deviate far from NWS predictions.  Twice I had my 101 classes write down the TV forecasts for an extended period and then we compared them to the NWS predictions--no statistically significant difference.  (In fact, one of the leading local TV weathercasters called the chair of my department complaining about such activities!  This is why tenure is good.)

What do you have to do to become a NWS meteorologist?  You need a real degree in meteorology (at least a B.S.)--which means you had a lot of math, physics, and atmospheric sciences.   Getting into the NWS is quite difficult and they only have a few positions a year open--so those that get in are strong candidates.  The NWS then has an extended and comprehensive training program and intern forecasters have to spend several years working their way up until they become journeyman staff.

Here in Seattle the local office is at the NOAA Sand Point facility, and they have a nice office with a wonderful view of Lake Washington.   The "Meteorologist in Charge"--the head weather honcho-- is Brad Colman, who has exceptional academic credentials (Ph.D. from one of the top programs, MIT), and deep operational experience. 
Brad Colman, Seattle NWS Head Guy.  He likes blue shirts.
He is so highly thought of by NWS management that he was asked to help write the NWS vision document for 2020.   The local office also has a Warning Coordination Meteorologist (Ted Buehner), who deals with local agencies and the media, particularly during major weather, and a Science and Operations
Ted Buehner working on an AWIPS Workstation
Officer (Kirby Cook), who works on software development and training.   Under them there are roughly 15 forecasters and interns.  And there is more--there is a Service Hydrologist, working on floods and heavy precipitation, and the NW Avalanche Center, which provides mountain forecasts for the region.  Plus meteorological technicians that keep everything working and administrative support staff.

NWS Forecaster Working.  Looks like a good storm!
The way they make and communicate their forecasts has changed radically during the past decade.  In the old days, a forecaster would type out the forecast, after looking a a variety of computer-based weather forecasts, satellite and radar imagery, and a wide range of other observations.  Not anymore.  Now they play around with graphical renditions of the weather--drawing the fields on a screen and then the forecast text is created by a computer. You thought video games are fun.  Making forecasts on their graphically oriented system--AWIPS--is better.
This is the Graphical Forecast Editor (GFE) used by NWS forecasters to create forecasts. Not for color-blind folks.
There are over a hundred similar offices around the U.S., each one associated with a Doppler radar.  Our office will have more than one soon when our new radar is online. With so many offices, forecasters can become masters of their local weather--which is very important.  How often do you hear the Weather Channel folks talk about the convergence zone, the Enumclaw winds, or the Sequim rainshadow?  And it is well known that the Weather Channel ignores the West Coast.  They will even admit it.

Behind each office there is a huge and expensive infrastructure--the observation systems, the computer forecasts on large supercomputers, the satellite and radar networks, and much more.  It is amazing it all works so seamlessly.   And there is more.  There are major NWS centers for specific forecasting issues:  a Storm Prediction Center for severe convection, a Aviation Weather Center for aviation meteorology, a Marine Prediction Center for the seas, etc.  All the numerical weather forecasts are made by the Environmental Prediction Center in Maryland (I was there last week).  They are located in an old and decrepit building worthy of a wrecking ball (no I wouldn't waste a good wrecking ball on it)--but next year they are moving to a state-of-the-art facility near the University of Maryland.

There is a lot of carping about supporting the Federal government these days, but some agencies, like the National Weather Service, are worth every penny and provide a huge benefit to the nation.
 
Support : Creating Website | Johny Template | Mas Template
Copyright © 2011. The Weather - All Rights Reserved
Template Created by Creating Website Published by Mas Template
Proudly powered by Blogger