The Driest August In Seattle History (and more to come)

| comments

I didn't want to mention this, worrying I might jinx it, but it is clear that August 2012 will the driest in Seattle history. So far we have had a trace--which means a sprinkle that is less than .01 inches. (The National Weather Service defines measurable rain as rain of .01 inches or more.)   The previous record was in 1974 when .01 inches had fallen.

The other record we working on is the longest stretch of dry days----for which the record is 51 days.
 Right now we are at 38 days...which I believe is something like the 7th longest dry spell.   But it is clear that we have at least 4-7 days of no rain ahead, so we will surely get into the mid-forties.

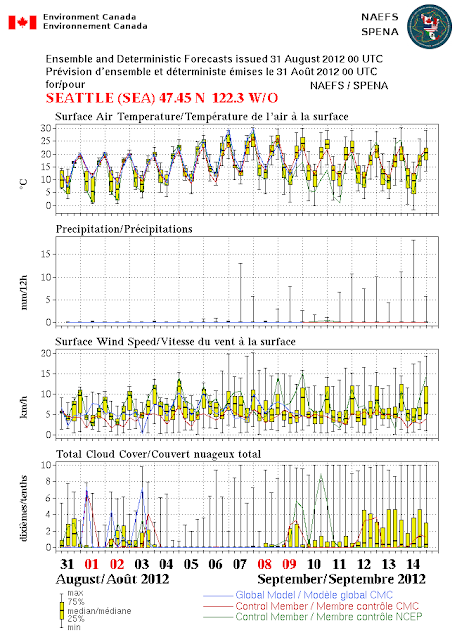
One of my favorite forecasting tool is from the output of the North American Ensemble Forecasting System (NAEFS), which combines the ensemble forecasts of the U.S. and Canadian forecasting efforts.  Remember, an ensemble is when we run the models many times to get an idea of the uncertainty and probabilities in a forecast.   Combining two ensembles is even better than using one!

So here is the output from NAEFS (keep in mind this is all in metric).  Temperatures are moderate (highs around 20C--68F), but then warm well into the 70s and low 80s, as a major ridge builds in next week).

But look at precipitation in the second panel.  Nothing for the next week...so we should get at least to a 45 day dry streak.  We will be in the top five at that point.   Within striking distance.

 Finally, today and this weekend we have some weak troughs over the area, bringing some morning low clouds and temps in the upper 60s to low 70s.  Fine for outdoor activities.  As the ridge revs up this week, highs will rise in the mid to upper 70s, perhaps 80s in some locations.  My tomatoes are very, very happy.

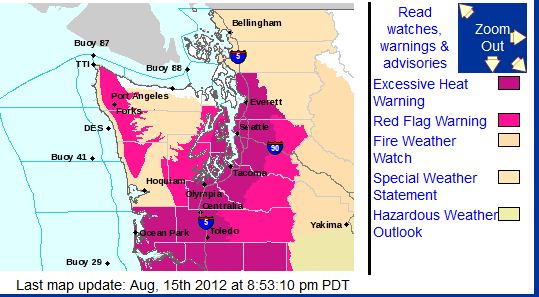
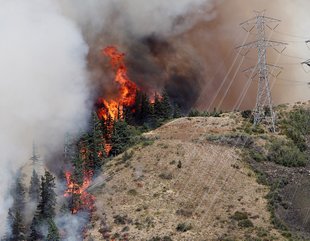
The only issue will be wildfires.  There will be no lightning, so that won't initiate them.  But the landscape of the region is very dry.  Consider the MODIS satellite imagery from yesterday:  many fires (and lots of smoke) over Idaho, and several fires over CA.


The Benefits of Tropical Storms and Hurricanes

| comments

Although there is a lot of media coverage of the damage and destruction accompanying tropical storms and hurricanes, such storms can also have important benefits.

For example, landfalling tropical storms can be an important source of water, water that can lessen droughts and recharge underground aquifers. 

For example, take tropical storm Isaac.  As many of you know, there has been a major drought in the mid-section of the nation, as illustrated by the graphic below:


Severe drought extends from northern Louisiana, through Missouri and Iowa, into Illinois and Indian.  And west into the Great Plains.  The Mississippi River has been running very low, with serious impacts on marine transportation, and the effects on agriculture have been profound.

The latest forecast models indicate that Isaac will bring soaking rain though much of this drought region.  For example, here is the predicted cumulative rainfall through Sunday at 11 AM PDT from the National Weather Service GFS model.  Note that a band of 4-10 inches extends through much of the drought zone.  The impact of this rain will be substantial and positive.

In fact, the moisture from Isaac will continue into the Northeast, damping down the dry conditions over upstate NY (see precip totals through late Tuesday):


The benefits of tropical storms and hurricanes doesn't end with rainfall.  It turns out the such storms can help maintain and build barrier beaches, such as those that line the East Coast.   Orrin H. Pilkey, James B. Duke Professor Emeritus of Geology at the Nicholas School of the Environment and Earth Sciences at Duke, noted that "Barrier islands need hurricanes for their survival, especially at times of rising sea levels such as now. It's during hurricanes that islands get higher and wider. From a purely natural standpoint hurricanes are a blessing for islands, even though they're a curse for people who live there." 

Hurricanes and tropical storms produce overwash of sand, and without that the islands get skinnier and skinnier and might disappear as sea level rises.

Overwash During Tropical Storms Can Help Maintain Barrier Islands
Most of the damage during hurricanes is along the coastal zone due to storm surge and associated flooding.   Too many people and structures are located along the coast and put themselves at risk.  To protect themselves, all kinds of geoengineering approaches are installed (e.g., jetties), many of which cause more problems then they solve.


The Real Threat of Tropical Storm/Hurricane Isaac

| comments

The media isn't talking about this much, but the real threat of tropical storm Isaac may be heavy precipitation and flooding....not winds and storm surge.

Recent model runs suggest the storm might stall over southern Lousiana, resulting in huge amounts of precipitation (storm totals of 12-24 inches in some locations).   Here is the latest storm total precipitation totals form the NWS GFS (78 hr total) and NAM (84 hour total) models for runs started at 1200 UTC this morning:


Pretty impressive precipitation.

 And here is a nice satellite image of Isaac at 11 AM with some observations plotted.  One report of 70 knots near the center.  No obvious eye at this time.  The lowest pressure observed is 987.8 hPa. 


First Frost and Tropical Storm Isaac

| comments

Nights are getting longer now and with clear skies some locations, particularly east of the Cascades in low spots, are dropping into the 30s and even to freezing.


For example, at Turnbull National Wildlife Refuge, southwest of Spokane (see map above) yesterday morning (25 August),  there were 3 hours at or below freezing for the surface air temperature (taken at 2 meters) and a ground (surface) temperature of 29 degrees F:

25 TRNW1 cn 0600 40 0 TSFC=39 SR=0
25 TRNW1 cn 0700 38 0 TSFC=36 SR=0
25 TRNW1 cn 0800 37 0 TSFC=34 SR=0
25 TRNW1 cn 0900 34 0 TSFC=33 SR=0
25 TRNW1 cn 1000 34 0 TSFC=31 SR=0
25 TRNW1 cn 1100 32 0 TSFC=30 SR=0
25 TRNW1 cn 1200 31 0 TSFC=29 SR=0
25 TRNW1 cn 1300 32 0 TSFC=29 SR=0
25 TRNW1 cn 1400 36 0 TSFC=33 SR=49
25 TRNW1 cn 1500 55 0 TSFC=52 SR=200
25 TRNW1 cn 1600 60 0 TSFC=67 SR=378

And this morning, a famous cold spot, Meacham Oregon (KMEH), got down to at least 33F, and probably hit freezing between the hours.  This is air temperature- frost was undoubtedly seen on the ground in places.  Yesterday the high at Meacham was 78F...so you needed a tee shirt and jacket to be comfortable there.


 Meacham is cold because it is location in a high mountain valley (elevation around 3800 ft), allowing cold air sinking off the terrain to settle in the cold protected basin.

Finally, for those interested in Tropical Storm Isaac, it is becoming increasingly clear that Tampa and the western Florida peninsula will not get the brunt of it--some heavy rain squalls and winds gusting to 20-40 kts should be the worse they experience (see graphic).

The latest satellite image does not show an eye yet for this storm:

 The latest radar image from Miami shows bands of intense showers rotating around Isaac's center:

Isaac should intensify into a hurricane over the warm waters of the Gulf and could be packing 80-100 kt winds when it strikes Louisiana and Mississippi.  Remember, my profession's ability to predict track (where the storm will go) has gotten very good, but our ability to predict intensity has hardly improved over the past thirty years.  New Orleans needs to be prepared and the oil-rigs battened down.

Probabilities that the wind speeds will exceed 50 kt.

Probability of Hurricane-Force (74 mph or more sustained winds)

Sea-Tac Heat

| comments

Roughly a year ago, I provided some evidence that the construction of the third Sea-Tac runway, with the ancillary taxiways and removal of a vegetated slopes, has resulted in an anomalous warming at the airport during warm summer days, particularly when the winds are from the north or northwest.  This is important for a number of reasons.  First, Sea-Tac is the spotlighted station on many local TV weathercasts (see image).  Second, it serves as a example of issues with our observational networks, where urbanization and construction can produce a warming signal distinct from the true warming of the general atmosphere.


Well, we had some warm weather recently...do we see the Sea-Tac warm anomaly?
For example, 4 PM this afternoon?  Here is a plot of nearby stations (KSEA is the airport).  72F at the airport (where the winds were north-northwest) and cooler for the nearby locations.


Or a few weeks ago, when the airport was 87F?  Again, nearby locations were cooler.


In the old days, Boeing Field, closer to the urban core of the city, was generally warmer than Sea-Tac.  But is that true now? Here is a plot of the temperatures at these two locations for the last four weeks.  Note that on the warm days (generally ones with lots of sun and northerly winds), Sea-Tac (SEA) was warmer than Boeing Field (BFI), often by several degrees.
Multiple such urbanization/development issues at locations around the world, and it is clear that it can obscure the true background temperature change signal that we are looking for.  Organizations, such as the National Climatic Data Center, have tried to develop algorithms to spotlight or remove such problems, but there success so far is mixed.  Satellite observations of temperature above the surface are a bit less problematic, although they have their own issues (like calibration of replacement satellites).

______

I will talk about some of the above issues during my talk on Orcas Island on Wednesday.


Want Warm Water--Get a Boat!

| comments

It is not unusual during summer to view a satellite image like the following, with a narrow sliver of low cloud along the  Northwest coast.  Why does this occur?

MODIS satellite image on August 12th
The answer:  cold water along the coast due to ocean upwelling (cold water coming up from below).  It is not usual during the summer to have coastal water temperatures 10F or more cooler e than what we observe 0-15 miles offshore.

Let me give you some recent examples.  Here is the latest National Weather Service sea surface temperature (SST) analysis for today...notice the cold temperatures from San Luis Obispo on the southern CA coast to our area, with the coldest temps along the northern CA coast.

 We can take a closer look off the Oregon coast by viewing the SSTs forecast by the Oregon ROM ocean modeling system (I used the NANOOS web site to plot this).  Lower to mid-50s along the coast while lower 60s are waiting 100 miles offshore.

Or take a look at the last NOAA SST analysis for the NW coast.  A veneer of cold water follows the coast.


Buoy 27 is found right off the Oregon/CA border and temperatures there have been dropping into the lower 50s.
 But head out to Buoy 46006 and temperatures in the in sultry mid to upper 60s.

The offshore water is warm enough for albacore tuna, so a number of Washington and Oregon fishing charter companies head offshore 10-30 miles to give anglers a chance to bring in some tuna.
Image courtesy of Deep Sea Charters, Inc. of Westport
Coastal cold water is typically a warm-season coastal ocean feature around here.  This is because the East Pacific High moves northward during the summer, producing northerly winds along the coast.  These northerly wind push the coastal water southward, but the Coriolis force then acts on the moving water, giving it a torque to the right (offshore).  Move surface water offshore and water comes up from below to take its place (see figure).


Midsummer Drought?

| comments

Your plants know it, and so will your water bills if you have a garden.  Over western Washington most places have not seen rain in roughly four weeks.

For Seattle, the last day of measureable precipitation (at least .01 inch) was July 22.
For Spokane and Wenatchee, its been dry since July 20th.

Are we in a drought now?  Lets check the latest U.S. Drought Monitor Information for Washington State.  No problem.  Most of the region is not in drought, with a little bit of dryness in a small portion of eastern Washington.

So how can this be?  No rain for a month and no drought?  Because this is pretty much normal for around here...in fact, we are one of the driest places in the country from mid-July through mid-August.

And you know the reason:  the general lack of thunderstorms during our summer due to the cold, Pacific Ocean.

We have had roughly 30 days without rain by tomorrow...but that falls WAY short of the record at Sea-Tac:  51 days in 1951.  

How does this year compare to last year at the same time (4 weeks ending 20 August)?  Here is the comparison--but be careful..the scales are different.  The red light red lines show the climatological highs, blue lines climatological lows--which are the same, allowing you to compare. Both years were on average were close to normal if you average the entire period, but this year had WAY more warm days.
The sunny, warm conditions of late have done wonders for my tomatoes--quite a few red, ripe ones already.

So how does it look for the period until Labor Day?   I am afraid the models show a series of troughs, bringing cooler than normal conditions and a chance of a few showers--but drier than normal-- during the next week to 10 days.  Consistent with this is the latest NWS Climate Prediction Center forecast for 8-14 days:

The pattern do not look favorable for convection of the Cascades and eastern Cascade slopes...which is good for the fire situation.

Orcas Island Talk:
I will be giving a talk: Global Warming, Separating Truth from Hype at 5:30 PM on August 29th at the Orcas Center Madrona RoomI will review the basics about global warming, its implications for the Northwest, and some issues regarding media coverage and claims of groups on both sides of the opinion spectrum.


Escaping the Lightning Bullet

| comments

The convective band is now passing through the region, and the strongest thunderstorms and most of the lightning passed offshore.  Little lightning over the Cascades and thus only a minor threat of lightning induced fires...some good news for those dealing with wildfires.

Here is a recent radar...you can see where the showers are:


The next issue will be the return of the northwesterly winds to Cle-Elum/Ellensburg.  Take a look at the 4/3 km high resolution UW forecasts for tomorrow AM and tomorrow night.  These are sustained winds..not gusts. The last figure is for 8 PM Sunday night...and the winds will be really cranking by then, with sustained winds of 20 knots in places.


New Wildfire Threat

| comments

The fires around Ellensburg and Cle Elum are now slowly being contained, with a huge assist from the heat wave west of the Cascades.  Ironically, the west-side heat and the associated thermal trough of low pressure has reversed the pressure difference across the Cascades, greatly weakening the strong winds over Kittitas County that allowed the fire to explode.

But everything is about to change...and not necessarily for the better.

Today clouds have inundated the coast and a shallow veneer of marine air pushed into the western side of the Cascades (see satellite picture Friday morning...you can also see some Asian smoke!).
 The cool air will be mixed out and temperatures will soon surge into the upper 80s and low 90s away from the water.   One last really hot day.

Tomorrow an upper level trough will approach and pass through our region late in the day (graphic).

This trough will result in upward motion and greatly increased instability, with the models suggesting a good chance of thunderstorms, particularly over terrain.    A measure of the instability is something called CAPE (Convective Available Potential Energy)...think of it as the potential "juice" for thunderstorm.  CAPE is a measure of the amount of buoyant energy that can be released when an air parcel accelerates upwards within a thunderstorm.  This graphic for the predicted values of CAPE for 10 PM on Saturday shows a substantial amount for this part of the country:


Here is  simulated cloud field for 5 PM Saturday...you can see the line of convective clouds/thunderstorms.

The trouble is that a lot of these thunderstorms will be high-based, meaning there will be lightning, but limited rain reaching the surface.  The threat of lightning-caused fires is substantial.

But it gets worse.  On Sunday, marine air will move into western Washington and the normal pressure difference will develop across the Cascades (see graphic).   This should rekindle the strong northwest

winds descending into Cle Elum to Ellensburg.   Here is a simulated vertical sounding with winds over Ellensburg for Sunday evening....strong NW flow near the surface.

Take a look at the precipitation forecast for the 24-h period ending 5 PM Sunday.  If anything, these simulations tend to underplay the convective rain.


The fire folks need to be ready for all this....hopefully the Kittitas fires will not rev up again and lightning will not initiate many new fires.  But a serious threat is there from both and the fire community must organize the resources to react quickly to damp down any lightning-caused fires.

More on this situation and the weekend weather forecast on KPLU.


Can a major wildfire occur west of the Cascade crest?

| comments

 Friday AM Update: Weather-Related Fire Threat this Weekend

Once the new runs come this morning, I will talk about the threat of lightning and strong winds returning to Kittitas County (Cle-Elum to Ellensburg).   Talked about it on KPLU this morning (9AM on air or on KPLU.ORG after 9:30 AM)


As our hearts go out to the people who have lost their homes, businesses, and animals in the Taylor Bridge fire near Cle Elum and Thorp, the natural question for west-side residents is:  could it happen here?  Could a major fire strike the region west of the Cascade crest?

The short answer is yes...it not only can happen but HAS happened, particularly along the western slopes of the Cascades.

The reality of this is brought home by the release today by the National Weather Service of a RED FLAG Warning for some parts of western Washington and Oregon (see graphic).  This is exceedingly rare.


Perhaps the most well known west-side fire is the famous Yacolt Burn of Sept. 11-13, 1902, the largest forest fire in Washington state history, which burned 238,920 acres -- more than 370 square miles -- and killed 38 people in Clark, Cowlitz, and Skamania counties.

Results of the Yacolt Burn
Fanned by strong, dry easterly winds, the fire traveled 30 miles in 36 hours.  A half-inch of ash covered Portland and the smoke was so thick that street lights went on mid-day in Seattle.  Here is a (poor) map the the Yacolt Burn area.

Then there was the great Tillamook Burn...a series of four fires in the old-growth forecasts along the northern Oregon coast range that destroyed a total of 355,000 acres during the period of 1933-1951.
Tillamook Burn
And in 1951 there was the famous Forks Fire that burned an area approximately 20 miles long and 2-1/2 miles wide, covering 32,668 acres.  Fanned by strong easterly winds, the fire moved 18 miles in eight hours.  You can see a repeated issue here for western Washington/Oregon fires...they tend to be associated with strong easterly winds and can move fast...real fast.  And most follow periods of both hot weather and drought.

Recently, I read a paper by Hemstrom and Franklin (Quaternary Journal, 1982) in which they talked about the role of big fires at Mount Rainier Park.  Looking a tree rings and other evidence, they determined that natural big fires cause trees to be replaced roughly every 430 years in the park.   The largest and oldest big fire occurred around 1230 AD and interestingly some of the oldest stands of trees in the the park date to that fire.   A place with very old trees is one of my favorite Rainier locations:  the Grove of the Patriarchs  near Ohanepecosh, which were protected by surrounding water.  Some of the trees there are over a 1,000 years old.

Surrounding rivers helped protect the Grove of the Patriarch from fire.
Fire has become a more serious threat, and global warming, although contributing, may not be the biggest issue.   We have poorly managed our forests, particularly on the drier, eastern slopes--stopping natural fires and letting the forest grow too dense.  And people have moved their homes up into the forest zone, in locations that are naturally and regularly visited by fire.  Fire is an important part of forest and grassland ecosystems in many locations.   We should not forget that.  And we should not forget that although we live in an area with very wet winters, our summers are some of the driest in the country.  There has been little rain during the past three weeks...and that is not unusual at all.

For those of you like probcast, it can be found at:
http://probcast.washington.edu/


Why a heat wave may slow down the Cle Elum fire

| comments

Wed Morning Update:  The pressure differences across the mountains have weakened and the winds of Ellensburg have died down.  Temperatures there are roughly 10F cooler than yesterday this morning, due to the light winds (less mixing of warm air down to the surface).  This situation should stop the explosive growth and restrain the westward movement of the fire, but it will still be hot today.


Smoke has filled much of the Northwest today, and we didn''t need any Asian smoke to assist.  The latest MODIS satellite image shows a huge quantity of smoke over California and southern Oregon from local wildfires, and, of course, there is the rapidly growing Taylor Bridge fire between Yakima and Ellensburg (see below).  This fire grew explosively during the past 24-h and now encompasses more than 25,000 acres.  A big part of the problem has been the winds...which have gusted to 40-50 mph in places.


Here is close up of the Cle Elum/Ellensburg area...you can see the smoke...although it is a bit subtle.


Why did it explode so quickly and why am I hopeful that the driving winds will eventually decline?

The Cle Elum to Ellensburg area, as most of you know, is a very windy corridor during much of the warm season.  It is downwind a major weakness in the Cascades that meteorologists often call the Stampede Gap.   During a normal summer day, when high pressure dominates the eastern Pacific and lower pressure is inland, westerly winds can blow quite powerfully through the Stampede Gap into Cle Elum and down into Ellensburg.  That is why there are so many wind turbines there.  But the problem is that IF a fire gets started that winds can cause them to spread rapidly and explosively...and unfortunately that has happened.  In some ways, this is one of the WORST places to have a fire because of the strong gap winds of the area.

 Here is the pressure and winds of the past two days for around 5 PM.  Classic westerly wind pattern.


Take a look at the surface (actually 30 ft) winds from the UW WRF model for 5 PM today.  You can see the strong winds in the Stampede Gap and downstream.

 The winds at the Ellensburg Airport came up yesterday and are still quite strong:
Ellensburg Sustained Winds

Ellensburg Gusts

But I am hopeful the winds will weaken around the fire, giving the fire folks a chance to bring it under control.  Why?  Because of the upcoming western Washington heat wave!   A thermal trough will move up the coast and will result in a weakening and then reversal of the pressure gradient.  Here are the forecast maps for the next two days at 5 PM to show you what should happen:


Beautiful thermal troughs and a big warm up for the west side.  Low pressure moves to the west side of the mountains!  As a result, the westerly winds will end overnight, being replaced by weak easterlies.   Hopefully, that will enable the firefighters to get this explosive blaze under control.

Orcas Island Talk on August 29th

I will be giving a talk: Global Warming, Separating Truth from Hype at 5:30 PM on August 29th at the Orcas Center Madrona Room.


Support : Creating Website | Johny Template | Mas Template
Copyright © 2011. The Weather - All Rights Reserved
Template Created by Creating Website Published by Mas Template
Proudly powered by Blogger